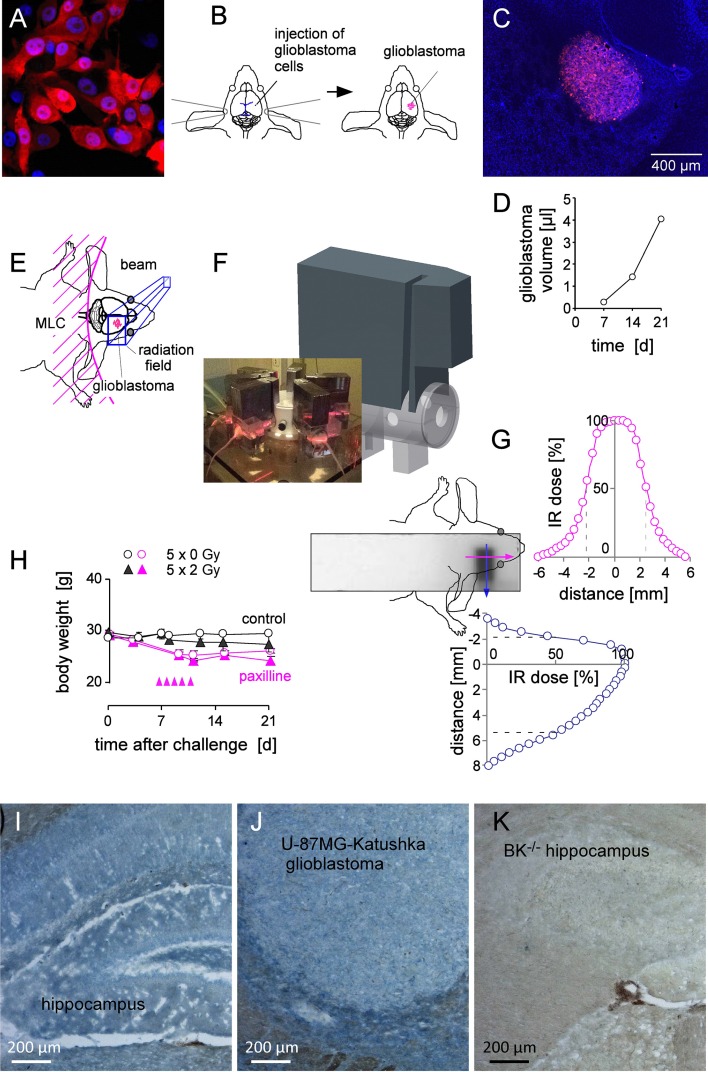
Figure 8. Fractionated IR of human glioblastoma xenografted orthotopically in NSG mice.
(A) Fluorescence micrograph of human U-87MG-Katushka glioblastoma cells grown in vitro (red and blue fluorescence indicate the Katushka protein and the DNA-specific DAPI fluorochrome, respectively). (B) Scheme illustrating the stereotactic transplantation of U-87MG-Katushka cells in mouse right striatum. The blue lines (left drawing) indicate bregma (top) and lambda (bottom). (C) Fluorescence micrograph of a U-87MG-Katushka glioblastoma in mouse brain 7 d after tumor cell challenge into the right striatum (DAPI-stained cryosection). (D) Time-dependent intracranial growth of U-87MG-Katushka glioblastoma. (E) Cartoon illustrating the radiation field. On-body lead shielding has been left out for better clarity (MLC: multileaf collimator). (F) Drawing of the mouse holder with mounted on-body leaf shielding. The photography on the lower left shows 6 mice during radiotherapy. (G) Dosimetry film and densitometrically analyzed dose distribution in y- (blue) and x-axis (pink) across the radiation field and adjacent shielded brain area. The site of dose deposition is indicated by the superimposed drawing of the mouse head. The dashed lines in the dose distribution plots indicate the 50% isodose. (H) Mean (± SE, n = 3) body weight of control (open circles) and fractionated irradiated NSG mice (closed triangles) during the first 3 weeks after intracranial challenge with U-87MG-Katushka cells. Control (black symbols) and mice receiving paxilline (pink symbols) are shown. IR fractions (2 Gy each) are indicated by the pink arrow heads. (I, J) BK protein expression (blue) in hippocampus and xenografted U-87MG-Katushka tumor of NSG mice. (K) Hippocampus of BK+/– mice served as negative control.

