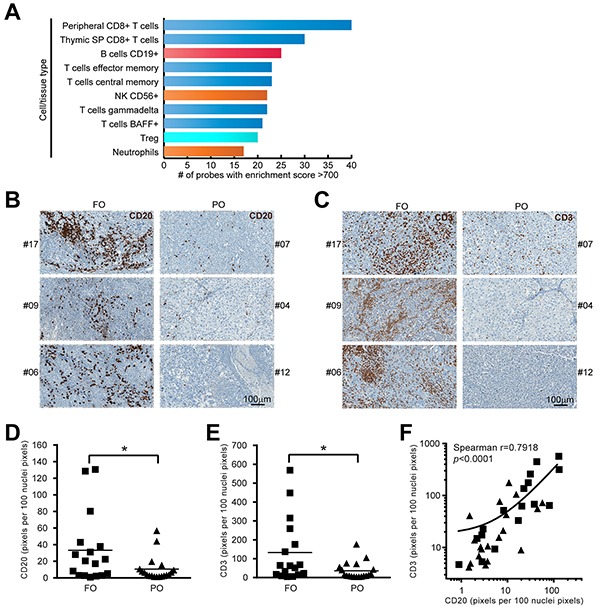
Figure 3. B cells are enriched in FO MM group.

A. Cell type profiling of FOS dataset. The enrichment score (ES) for each FOS probe was assessed in different cell/tissue types contained in “Gene Enrichment Profiler” database (see Materials and Methods). The likelihood of diverse specific cell types infiltrating the tumors was established by ranking the cell/tissue types according to their number of probes with high enrichment score. The top-10 cell/tissue types from the database are shown: T cells (blue), B cells (red), innate effector cells (orange), Tregs (light blue). B. Representative examples of CD20-IHC labeled FFPE sections from an independent group of MM showing more B cells infiltrates in FO patients compared to PO patients. C. Representative examples of CD3-IHC labeled FFPE sections from an independent group of MM showing more T cells infiltrates in FO patients compared to PO patients. D. Staining quantification using ImageScope (see Materials and Methods) indicated CD20 label was increased in the FO group (n=36, p<0.05). E. Staining quantification indicated CD3 label was increased in the FO group (n=36, p<0.05). F. correlation between CD20 and CD3 levels in MM (n=36, Spearman correlation, p<0.0001).
