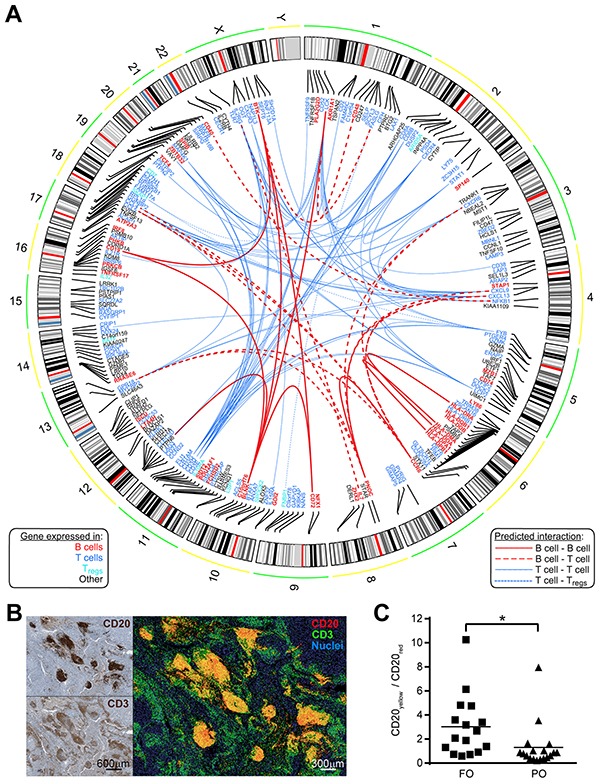
Figure 4. Predicted interactions network from FOS connect cell types in FO MM.

A. Circos plot depicting a network of experimentally observed or high-level-of-confidence predicted interactions was built with integrative information from STRING 9.1 (for interaction evidence) and the Gene Enrichment Profiler (for evidence on cells expressing those nodes/genes) databases. Chromosomal location is shown for each of the 228 overlapping genes. Gene symbols were colored based on the top-10 cell type from Figure 3A showing the highest expression for that gene: B cells (B cells CD19+); T cells (Peripheral CD8+ T cells, Thymic SP CD8+ T cells, T cells effector memory, T cells central memory, γδ T cells, T cells BAFF+); Regulatory T cells (Tregs). Edges represent curated interactions with experimental evidence or database score higher than 0.7 according to STRING 9.1: B cell-B cell (continuous bold red), B cell- T cells (dashed bold red), T cells- T cells (continuous blue), and T cells- Tregs (dotted blue). B. B cells show proximity to T cells in MM tissue. Relative proximity of B cells to T cells was revealed by false-color, fluorescent-like image composite (right) of consecutive MM sections individually stained for CD20 and CD3 markers (left). Additive red and green mixing yields yellow in areas of close proximity. C. Quantification of CD20yellow/CD20red ratio in fluorescent-like image composites of MM sections (using Fiji ImageJ, see Materials and Methods) showing higher ratios in FO patients compared to PO patients (n=34, p<0.05).
