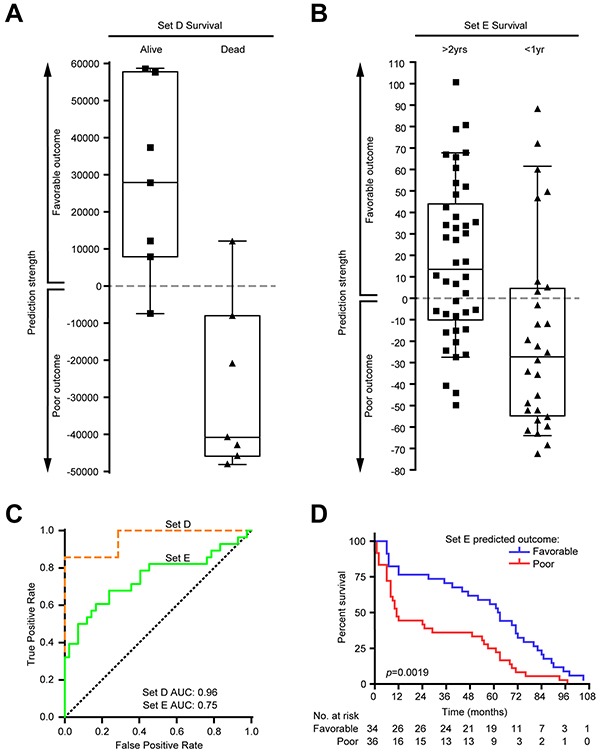
Figure 5. Validation of FOS as outcome predictor in two independent melanoma datasets.

Weighted gene voting (WGV) using the votes for FOS genes correctly predicted outcome in two independent melanoma stage III datasets. A. In Set D (see Materials and Methods), 6/7 (85.7%) patients of favorable outcome and 6/7 (85.7%) patients with poor outcome were correctly predicted. Positive predictive value (PPV): 0.857; negative predictive value (NPV): 0.857; specificity: 0.857; sensitivity: 0.857. B. In Set E, 26/42 (61.9%) patients of favorable outcome and 20/28 (71.4%) patients with poor outcome were correctly predicted. PPV: 0.765; NPV: 0.556; specificity: 0.714; sensitivity: 0.619. C. Receiver-operating characteristic (ROC) plot showing the performance on both datasets of WGV using FOS genes. Area under the curve (AUC) values are indicated. Dotted diagonal line shows random chance. D. Kaplan-Meier curves of survival proportions for Set E patients based on the WGV prediction. Patients with negative class (predicted poor outcome) had significantly reduced survival (p=0.0019, log-rank test; survival times correspond to months after tumor resection). Survival information available for Set D patients (“alive” or “dead” by certain date) was insufficient to generate a Kaplan-Meier curve.
