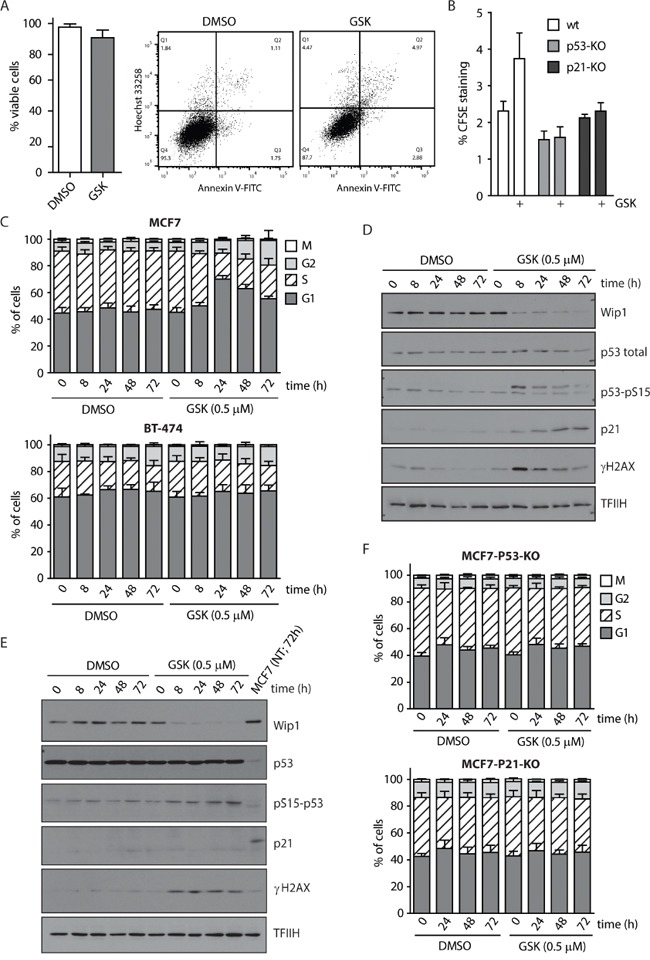
Figure 3. WIP1 inhibition leads to G1 and G2 phase accumulation in MCF7 cells.

A. MCF7 cells were treated with DMSO or GSK2830371 (0.5 μM) for 5 days and percentage of living cells (Hoechst/Annexin V negative) was determined by flow cytometry. Error bars represent SD. B. MCF7, MCF7-P53-KO or MCF7-P21-KO cells were incubated with CFSE and subsequently treated with DMSO or GSK2830371 (0.5 μM) for 3 days. Fluorescent signal of CFSE was measured by flow cytometry. Plotted is the CFSE signal relative to the signal measured at day 0. Error bars represent SD. C. MCF7 or BT-474 cells were treated with DMSO or GSK2830371 (0.5 μM) for indicated times, pulsed with BrdU before fixation and distribution of cell cycle phases was determined by flow cytometry. BrdU incorporation was used as a marker of replication and pS10-H3 as a marker of mitotic cells. Error bars represent SD. D. MCF7 cells were treated as in C and analyzed by immunoblotting. E. BT-474 cells were treated as in C and analyzed by immunoblotting. F. MCF7-P53-KO or MCF7-P21-KO cells were treated with DMSO or GSK2830371 (0.5 μM) for indicated times, pulsed with BrdU before fixation and distribution of cell cycle phases was determined as in C. Error bars represent SD.
