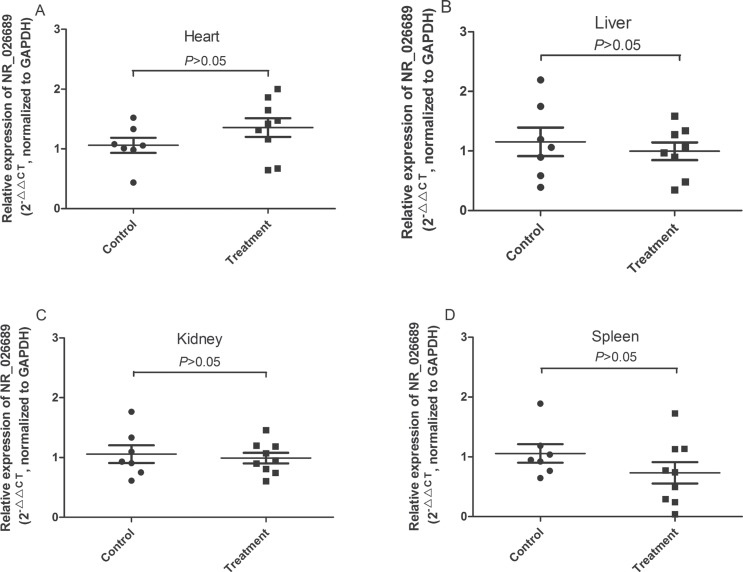
Figure 6. The level of NR_026689 expression in rat other organ tissues from the control group and NNK-treatment groups.
Levels of NR_026689 expression in the heart (A), liver (B), kidney (C) and spleen (D) tissues in rats treated with NNK were determined using qRT–PCR and compared with those of control rats (n = 7 for control group; n = 9 for NNK treatment group) at the 95th week. Statistical differences were determined by an unpaired Student's t test.

