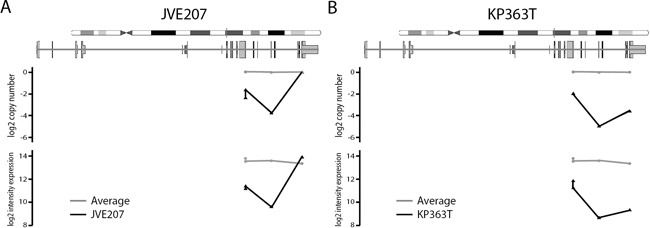
Figure 3. Probe level copy number and expression intensity for SMAD4 in JVE207 and KP363T.

For both cell lines the copy number level and intensity in the expression data is compared to the average of all 20 cell lines. The JVE207 A. and KP363 B. data is plotted in black and the average of all 20 cell lines is shown in grey. Probes are plotted on their location in the SMAD4 gene. All probes with reduced signal in the copy number data also show a reduction in intensity in the expression data.
