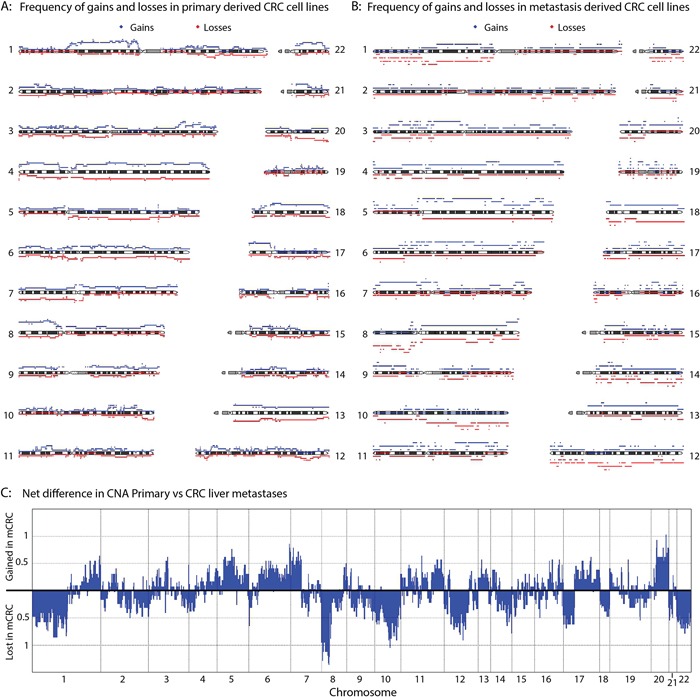
Figure 4. CNA comparison between primary and metastasis-derived cell lines.

The frequency of gains (red) and losses (blue) for the primary CRC derived cell lines A. and the liver metastasis cell lines B. is plotted. C. Combining the frequency of gains and losses for each position per group, total frequencies of gains and losses in the metastasis-derived cell lines compared to the primary CRC derived cell lines was calculated.
