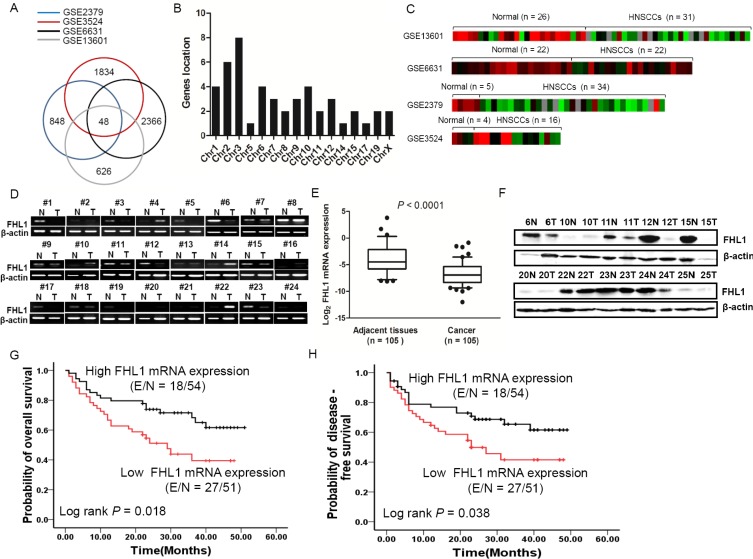
Figure 1. Downregulation of FHL1 was identified in four GSE databases (GSE2379, GSE3524, GSE6631 and GSE13601) and 105 HNSCCs.
(A) 48 differentially expressed genes were identified by bioinformatics and Venn analysis from four GSE databases (blue cycle indicates GSE2379, red cycle indicates GSE3524, black cycle indicates GSE6631 and gay cycle indicates GSE13601). (B) 48 differentially expressed genes were localized in diverse Chromosomes. (C) The Heatmap of X-linked FHL1 was shown in four GSE databases. (D) Expression level of FHL1 mRNA in 24 representative HNSCCs and the corresponding adjacent tissues by using RT-PCR. (E) Expression levels of FHL1 mRNA were decreased in HNSCCs (n = 105) compared with adjacent tissues (n = 69) using real-time PCR analysis. For each sample, the relative mRNA level of FHL1 was normalized to β-action. The line within each box represents the median negative Ct value; the upper and lower edges of each box represent the 75th and 25th percentiles, respectively. (F) Expression level of FHL1 in 10 representative HNSCCs and the corresponding adjacent tissues tested by Western blotting. (G) Kaplan-Meier survival curve indicated overall survival by evaluation of FHL1 mRNA levels in the training cohort. (H) Kaplan-Meier survival curve indicated disease-free survival by evaluation of FHL1 mRNA levels in the training cohort.

