
Figure 4. Electronic microscopy evidence of autophagy in obatolcax-treated cells.
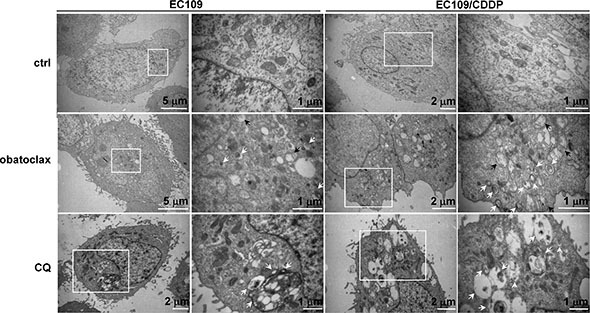
EC109 and EC109/CDDP cells were treated with obatoclax (0.25 μM) or CQ (50 μM) for 12 hours and subjected to electron transmission microscopy. White arrows point to the autophagic vacuoles while black arrows point to the swollen mitochondria. For each treatment or control group, transmission electron microscope images were randomly chosen, from a field of at least 100 cells. Scale bars are included within the micrographs.