
Figure 6. Intracellular distribution of obatoclax.
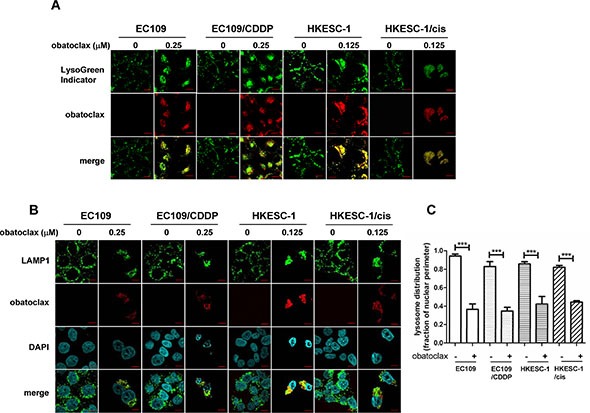
(A) Cells were treated with obatoclax at the indicated concentrations for 3 h. Lysosomes in live cells were stained with LysoGreen Indicator reagent. Scale bars, 10 μm. (B) Cells were treated with obatoclax at the indicated concentrations for 3 h. Immunofluorescent staining for LAMP1 marked lysosomes. The results shown are representative images. Scale bars, 10 μm. (C) Quantification of lysosome distribution (lysosome distribution relative to nuclear perimeter) is shown. For each point, at least 30 cells were pooled from three independent experiments. ***P < 0.001 as compared to control cells.