
Figure 2. Effect of siHER2d75 on HER2 protein expression levels, cell cycle, and apoptosis in the BT474 cell line.
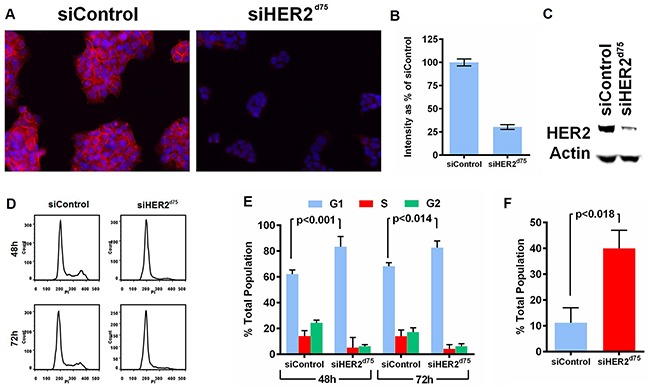
A. HER2 protein reduction by immunofluorescent imaging (200× magification). B. Corresponding quantified mean signal intensity of HER2. C. HER2 protein reduction analyzed by western blot. Cell were transfected with 10 nM siHER2d75 or siControl for 72 h prior to analysis. D. Flow cytometry analysis of the treated cells stained with propidium iodide (PI) after 48 h or 72 h. E. The corresponding percent distribution of cell cycle analyzed using FlowJo. F. The percent apoptotic cells measured by YO-PRO-1 staining of treated cells after 72 h.