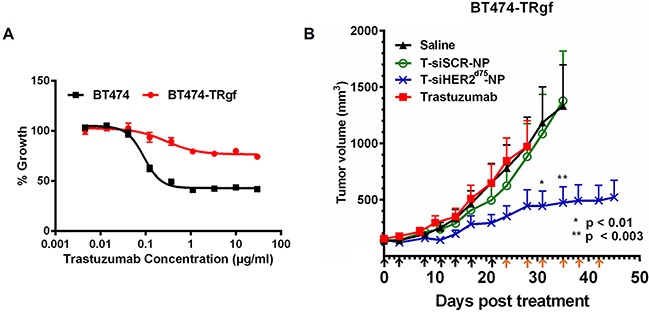
Figure 8. Efficacy of T-siHER2d75-NP in BT474-TRgf.

A. In vitro trastuzumab dose-response curve (as % growth 5 days post-treatment) of BT474 and BT474-TRgf. B. Mice bearing BT474-TRgf xenografts (n=5-7/group) were injected via tail vein with saline, trastuzumab (2.5 mg/kg given IV, twice weekly) or trastuzumab-conjugated nanoparticles (T-NP) loaded with siHER2d75 or siSCR. Arrows below the x-axis indicate nanoparticles injections; black indicate 1.25 mg siRNA/kg; orange, 2.5 mg siRNA/kg. Tumor volumes are presented as means ± SEM. Specified p-values are against the saline control.
