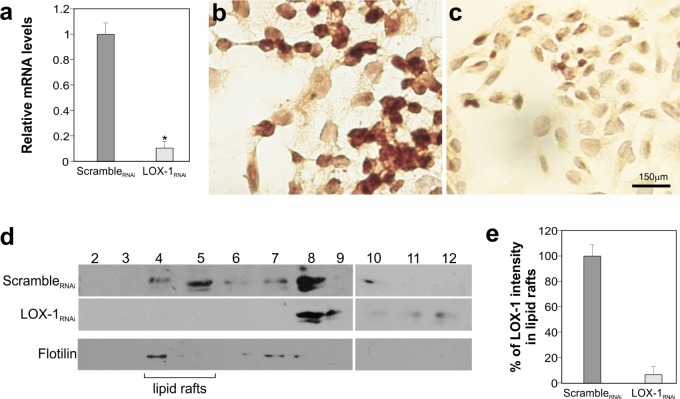
Figure 3. LOX-1 inhibition by shRNA in DLD-1 cells.
a. Real time-qPCR analyses of LOX-1 mRNA levels in DLD-1 cells 6 days post virus administration. Data are representative of three independent experiments and reported as mean±SEM (*P <0.05). b. Immunocitochemistry of LOX-1 expression of DLD-1 transduced by scrambleRNAi and c. by LOX-1RNAi.; magnification 40X. d. Detergent-free purification of caveolin-rich domains by sucrose gradient. An aliquot of each fraction, collected from the top to the bottom of the gradient, was subjected to immunoblot analysis carried out with anti-LOX-1 and anti-flotilin antibodies. The numbers were referred to different fractions; in particular fractions 4 to 5 were designated as lipid rafts indicated by the marker protein flotilin. e. Histogram shows the densitometric measurements performed to compare the intensity of LOX-1in lipid raft fractions (fractions 4 and 5) derived from scrambleRNAi and LOX-1RNAi DLD-1 cells. The data represent the average ± S.D. of three separate experiments.

