
Figure 2. LncRNA expression profiling in plasma cell dyscrasia.
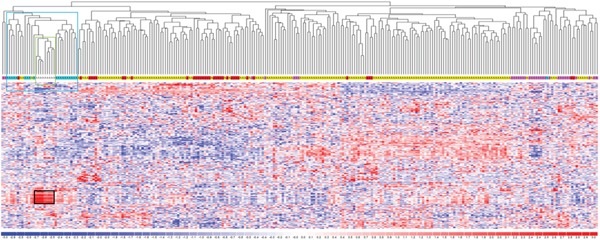
Hierarchical clustering of the 268 samples using the 230 most variable lncRNAs (patients in columns, lncRNAs in rows). The color scale bar represents the relative lncRNA expression changes normalized by the standard deviation. Color above the matrix indicates the type of samples: white, light blue, pink, yellow, and red represent Normal (N), MGUS, SMM, MM, and PCL samples, respectively. Specific types are enriched in colored sub-branches (see text). Black box identifies lncRNAs strongly upregulated in normal samples (see text).