
Figure 5. MALAT1 expression deregulation in MM patients.
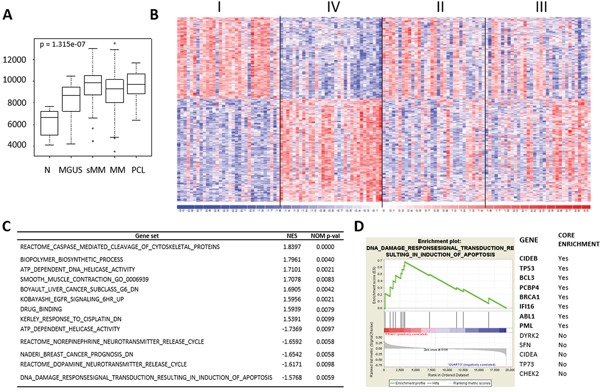
A. Box plot of MALAT1 expression level in 9 N, 20 MGUS, 33 SMM, 170 MM, and 36 PCL samples, as detected by GEP; p-value was calculated by Kruskal-Wallis rank sum test. B. Heatmap of the 518 differentially expressed lncRNAs identified by comparing the first vs fourth quartile of 129 MM patients stratified into four groups based on MALAT1 expression level. C. Gene sets significantly up- and down-regulated in MALAT1 quartile IV versus I. Gene sets were selected on nominal p-value<0.01 and are ordered according to NES value. D. Enrichment plot of “DNA damage response signal transduction resulting in induction of apoptosis” gene set detected by GSEA. The green curves show the enrichment score and reflect the degree to which each gene (black vertical lines) is represented at the bottom of the ranked gene list. Genes contributing to the core enrichment in the gene set are indicated in bold.