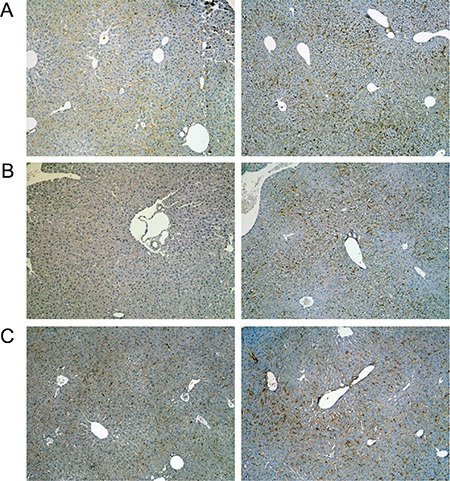
Figure 6. Immunohistochemistry of the T-cell protein tyrosine phosphatase in livers of control and diclofenac treated mice.

(A) from the left to the right: Control and single dose 30 mg/kg diclofenac (day 1). (B) from the left to the right: Control and repeated dose 30 mg/kg diclofenac (day 3). (C) from the left to the right: Control and single dose 150 mg/kg diclofenac (day 1). Magnifications 60x.
