
Figure 3. Principal component analysis (PCA) of biomarker analyses.
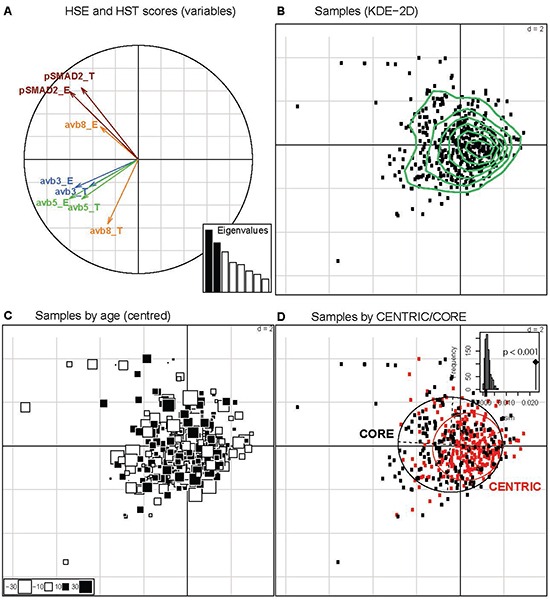
A. The histoscores of the markers for tumor (HST) and endothelial cells (HSE) are represented on the first vectorial plan of the PCA. The two first distinct eigenvalues (Histogram of Eigenvalues, in black) explain 42.6% of the total variation. B. The patient samples are projected onto the two first axes of the PCA and patterns were explored by Kernel Density Estimation (KDE) in these two dimensions (green curves). No indications for marker driven subgroups are observed. C. Each patient sample is represented by a square, with proportional size to the distance to the mean age (55.3 years). The white and black squares identify the patients with age inferior or superior to the mean age, respectively. D. The impact of the study (CENRTIC/CORE) was investigated on the two first axes visualized by the inertia ellipses for CENTRIC (red) and CORE (black). A significant difference is observed (P < 0.001, between-group permutation tests) illustrated by a histogram, where the observed value is given by a black vertical line.