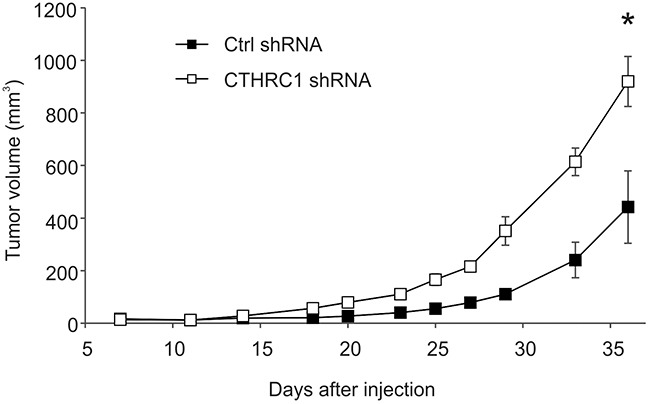
Figure 6. Growth curves of tumors induced by control (ctrl) shRNA-expressing and CTHRC1-knockdown WM239 cells in nude mice.

Cells (6 × 10⁶) were injected subcutaneously into the lower flank of the individual mice (six mice per group). Tumor volume was measured with a caliper two to three times per week. Bars represent standard deviations. *P < 0.00001.
