
Figure 1. UBE2T expression in NPC patient samples by IHC.
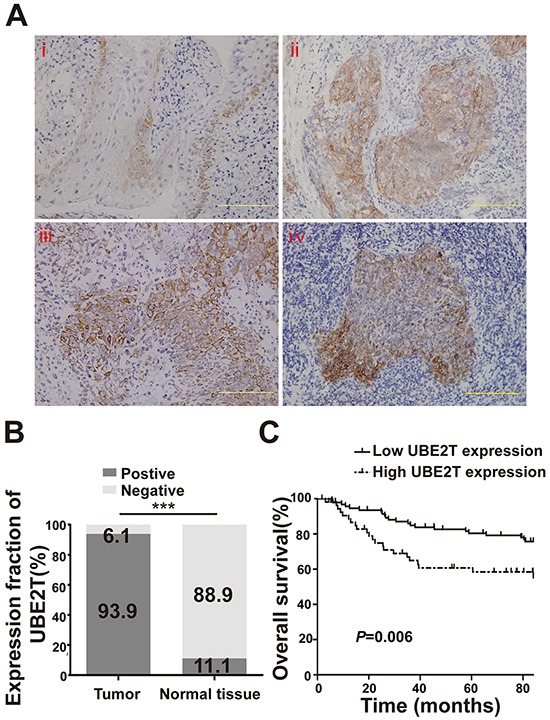
A. Representative image of normal nasopharyngeal mucosal tissue (i) Representative images of nasopharyngeal carcinoma tissue (ii and iii) and a typical cancer nest (iv). Scales indicate 100 μm. B. UBE2T expression in tumor tissue and adjacent normal tissue by IHC (Chi-square test, ***P<0.001). C. Kaplan–Meier survival curve of 149 patients based on the level of UBE2T expression in tumor tissue.