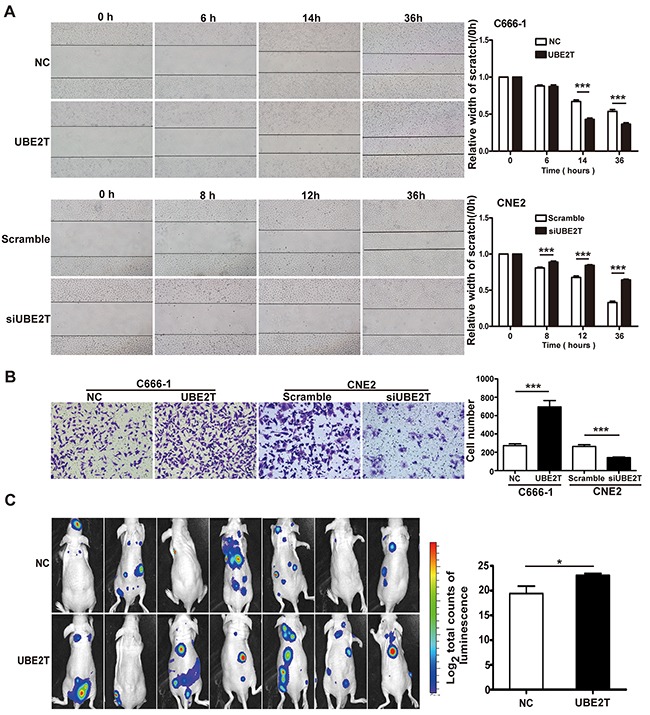
Figure 3. UBE2T promotes NPC cell migration, invasion, and metastasis in vitro and in vivo.

A. Representative images of scratch assay from indicated groups at different time points (left); The bar chart represents mean ± SEM of relative scratch width (relative to that at 0 hour width; n=5, ANOVA, *P<0.05, and ***P<0.001). B. Representative images of the matrix-coated transwell assay from indicated groups (left). The bar chart represents mean ± SEM number of invasive cells from 5 random 20X objective fields (Student's t-test, ***P<0.001). C. Images of nude mice photographed with IVIS Lumina II system at 17 days after injecting C666-1 cells in the tail vein. The bar chart represents mean ± SEM of log2 total luminescence signal intensities (n=7, Student's t-test, *P=0.034).
