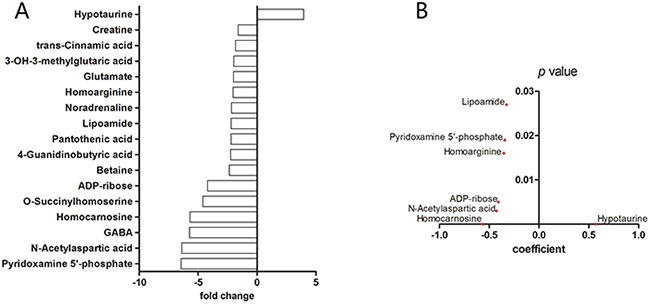
Figure 1. Capillary electrophoresis – mass spectrometry of gliomas.

A. CE-MS of grade-IV gliomas versus control brain tissue. Compounds with significantly different concentrations between the two groups are shown (p<0.05 student's t-test). The y-axis displays the varying compounds, and the x-axis represents fold-change in metabolite concentration. B. Spearman rank-order correlation for concentration of compounds in (A) across control brains and glioma grades II – IV as determined by CE-MS. The y-axis displays p values and the x-axis shows Spearman coefficient for each compound. Only compounds with coefficient p value less than 0.05 are shown.
