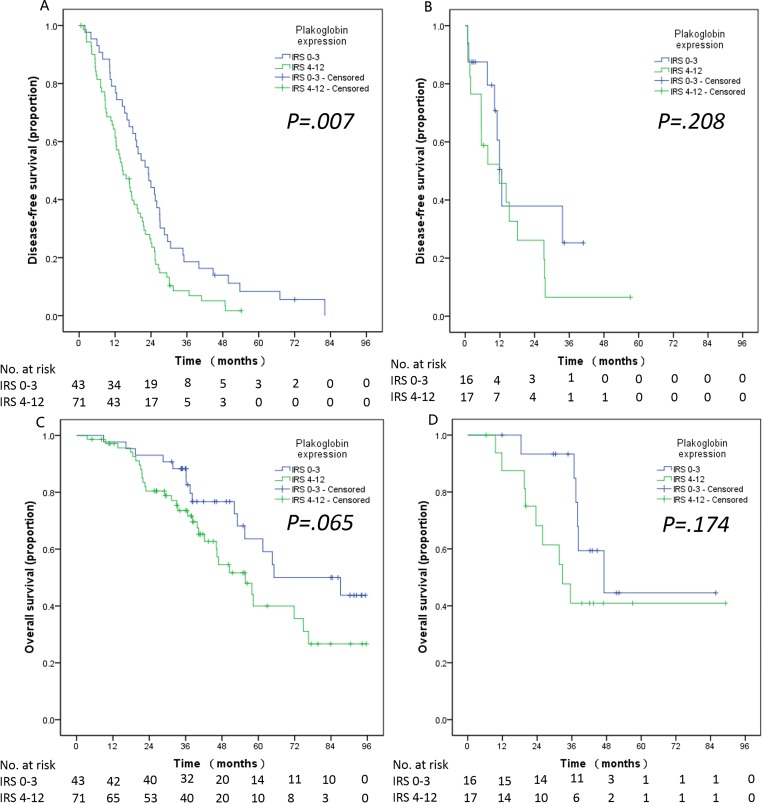
Figure 4. Cytoplasmic plakoglobin expression, DFS and OS are shown by different columns, the subgroups are shown in the different rows according to whether the presence of metastasis in patients before surgery or not.
The relationship between plakoglobin expression and DFS A. and OS C. in the patients without metastasis before surgery. The relationship between plakoglobin expression and DFS B. and OS D. and in the patients with metastasis before surgery.

