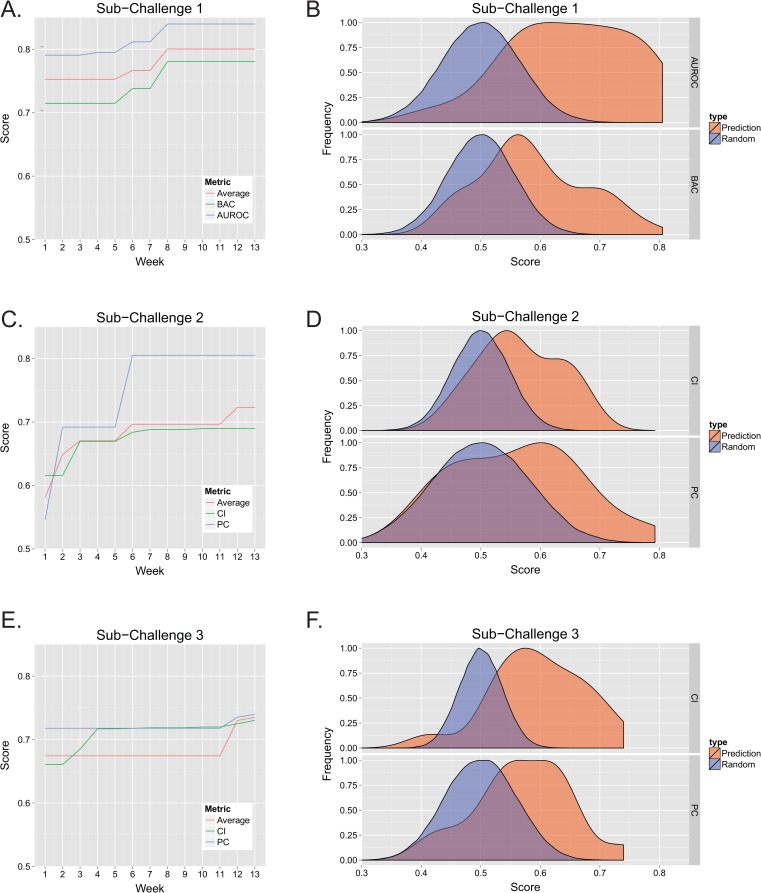
Fig 2. Model performance.
The performance of each model was tracked during each week of the challenge. Each sub-challenge was scored using two different metrics. BAC and AUROC were used for SC1, while CI and PC were chosen for SC2 and SC3. The score of the highest performing model was determined each week, either using each metric independently, or by averaging both metrics, and is shown for SC1 (A), SC2 (B), and SC3 (C). Note, if the highest score for any week did not exceed the previous weeks score, the previous score was maintained. The probability density of the final scores (normalized to a maximum of 1) was also determined and for each metric in SC1 (B), SC2 (D), and SC3 (F). The probability density of the null hypothesis, determined by scoring random predictions, is also indicated.

