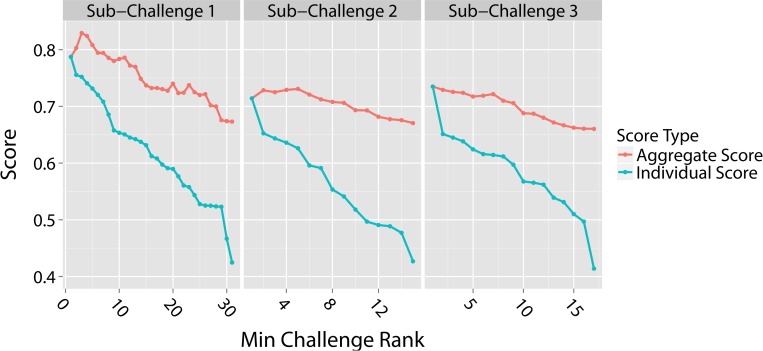
Fig 3. Aggregate and individual model scores.
Aggregate scores were determined by averaging the predictions of each model with the predictions from all the models that out-performed it. Model rank is plotted along the x-axis from highest to lowest, with a rank of 1 assigned to the top performing team. Therefore, any given point along the x-axis indicates the minimum rank of the model included in the aggregate score, e.g., a minimum challenge rank of 2 includes predictions from both the rank 2 team and the rank 1 team which out-performed it. The aggregate scores (red lines) were compared to individual team scores (blue lines) for SC1, SC2, and SC3. In each case, the scores reported are the average of the two metrics used for that sub-challenge.

