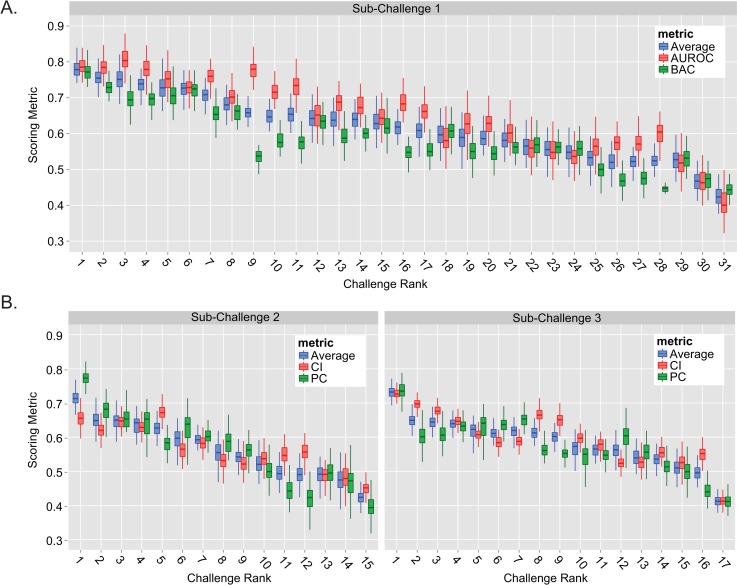
Fig 4. Stability of model performance.
Model stability was evaluated for SC1 (A), SC2 (B, left) and SC3 (B, right) by scoring final predictions on 1000 different random subsets of the test set samples (each subset was 60 patients, ~80% of the week 13 test set). The resulting distribution of scores was plotted against each teams overall challenge rank. Note, the center horizontal line of each box indicates the median score. Challenge ranks are ordered from highest to lowest, where a rank of 1 indicates the highest rank.

