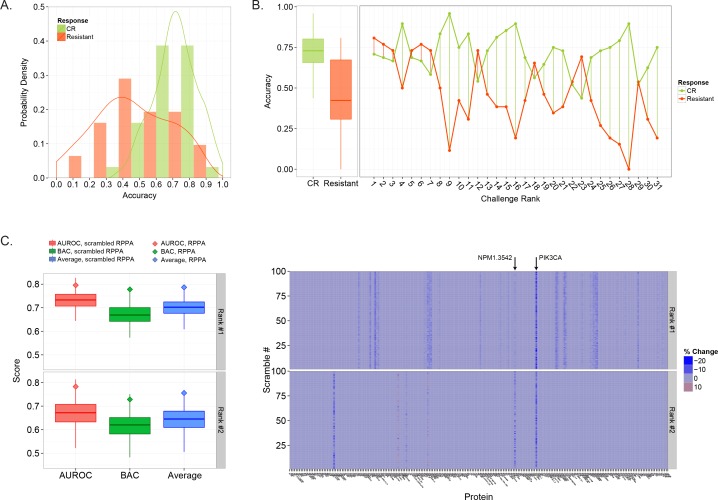
Fig 5. The role of patient outcome and proteomics data in determining prediction accuracy.
A) The probability density of prediction accuracy evaluated separately for CR and Resistant patients. (B) Comparison of individual model accuracy for CR and Resistant patients (right) compared to the distribution over the population (left). The midline of the box plot indicated median accuracy while the lower and upper box edge indicated 25th and 75th percentile. (C) The distribution of scores obtained using scrambled RPPA data for the two top performing teams in SC1 (Rank #1 and Rank #2). For each metric, the score obtained using the original RPPA data (not scrambled) is indicated by a diamond. (D) Heat map showing the percent difference in score (average of BAC and AUROC) between predictions obtained using the original RPPA data (not scrambled) and predictions made using data where each protein was scrambled separately over 100 assessments. The y-axis indicates the result for each scrambled protein assessment, 1–100, while the x-axis indicates each protein.

