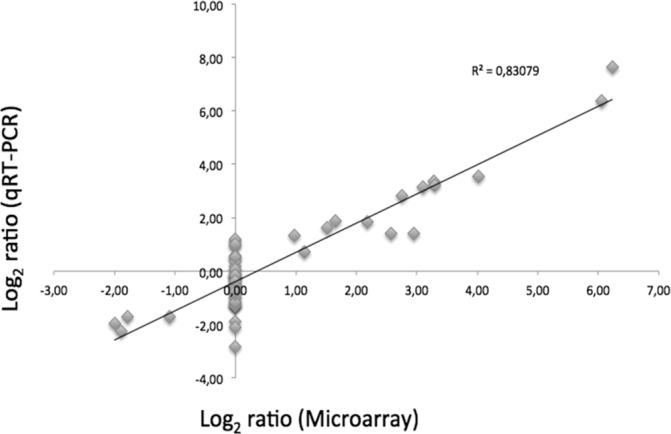
Fig 2. Validation of microarray data by qRT-PCR.

Fold changes in in vivo gene expression at 4, 6, 14 and 38h post-infection, compared to the in vivo expression at 8h post-infection, were measured by microarray and qRT-PCR. Data are plotted as log2 ratios of microarrays data (x-axis) compared with those of qRT-PCR (y-axis).
