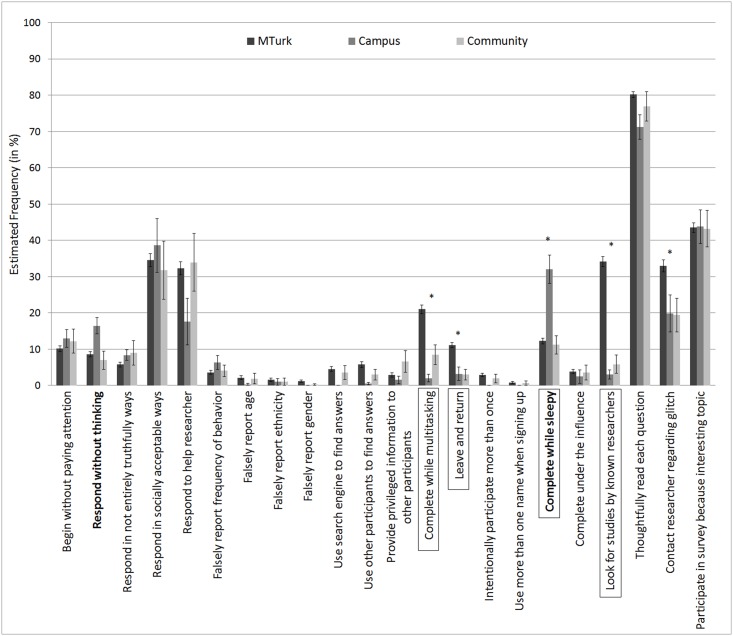
Fig 1. Estimates of the frequency of problematic respondent behaviors based on self-estimates.
Error bars represent standard errors. Behaviors for which MTurk participants report greater engagement than more traditional samples are starred. Behaviors for which campus and community samples vary are bolded. Behaviors which vary consistently in both the FO and the FS condition are outlined in a box. Significance was determined after correction for false discovery rate using the Benjamini-Hochberg procedure. Note that frequency estimates are derived in the most conservative manner possible (scoring each range as the lowest point of its range), but analyses are unaffected by this data reduction technique. For complete text of each behavior, see Table 1.

