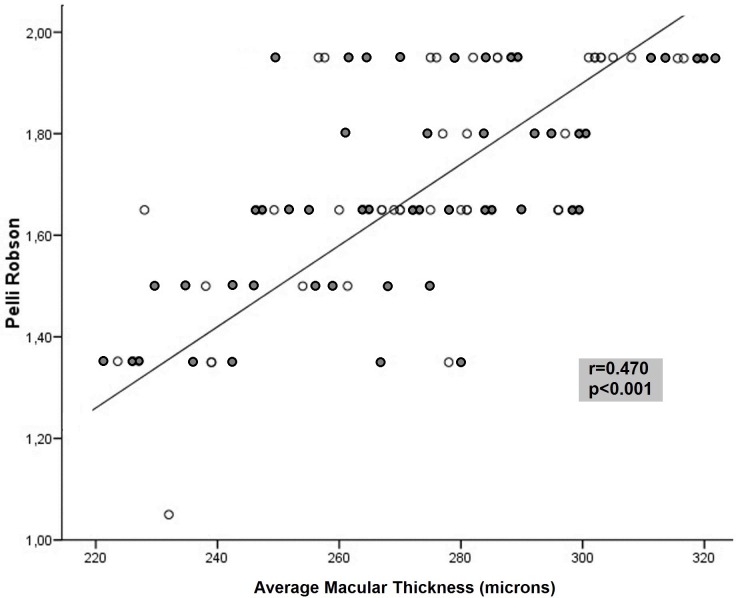
Fig 1. Correlation between the average macular thickness and contrast sensitivity vision measured with the Pelli Robson test in patients with multiple clerosis.
Dark symbols represent data from patients with a previous episode of optic neuritis, whereas light symbols represent patients without a previous episode of optic neuritis.

