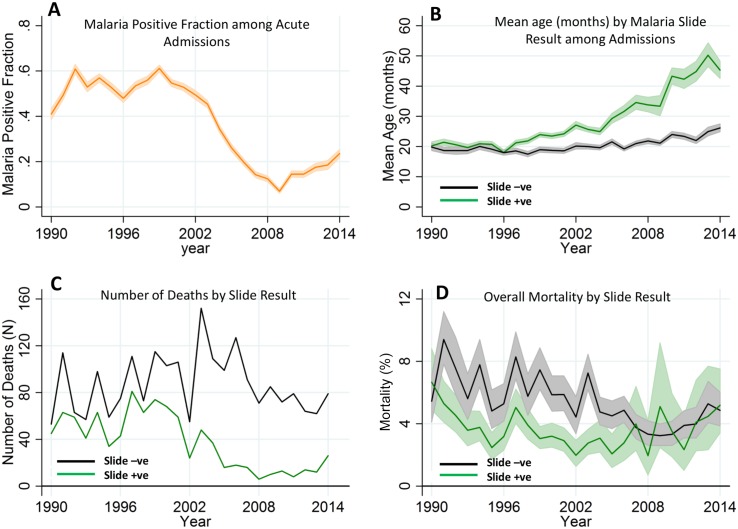
Fig 2. Temporal trends of malaria positive fraction (MPF), age of slide positivity, and mortality among acute admissions.
Panel A shows the temporal trend of MPF. Panel B shows the trends of mean age over time for the slide-positive and slide-negative admissions. Panel C shows the temporal trends of absolute number of deaths, and Panel D shows case fatality rates. Shaded areas in panels A, B, and D represent 95% CIs.

