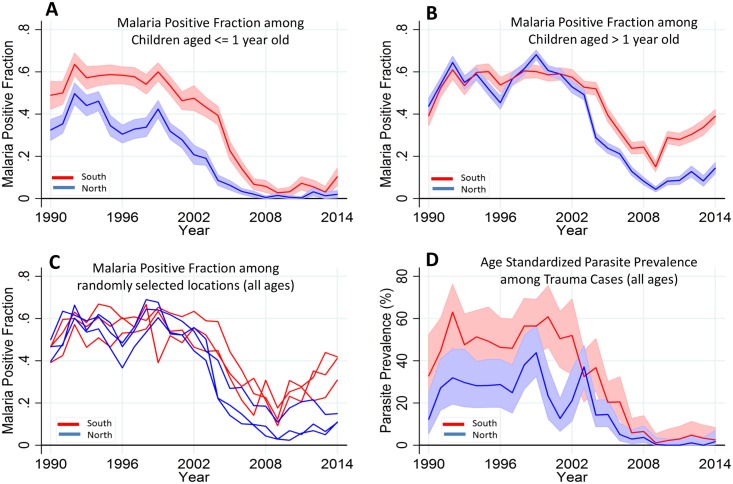
Fig 4. Temporal trends of MPF by age and parasite prevalence.
Panels A and B show the temporal trends of MPF in admitted children aged ≤ 1 y old and children aged > 1 y old, respectively; the red line represents the southern region, while the blue line represents the northern region of the creek. Panel C shows all age MPF for randomly selected locations from the southern and northern regions. Panel D shows the age-standardized parasite prevalence (i.e., Plasmodium falciparum parasite rate [PfPR2-10]) among the trauma cases. Shaded areas in panels A, B, and D represent 95% CIs.

