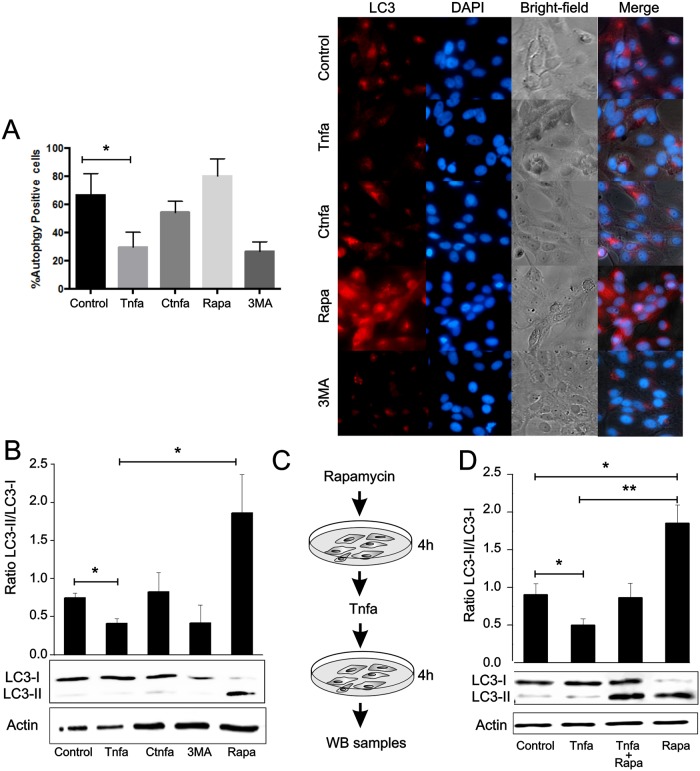
Fig 5. Tnfa inhibits autophagy.
(A) ZF4 cells were treated with 0.1 μg of Tnfa or inactivated Tnfa (CTnfa), 1μM of Rapa, 10 mM of 3-methyladenine (3MA) or remain untreated. After 4 hours cells were fixed and then incubated with an antibody anti-LC3. Cells were finally stained with a fluorophore-conjugated secondary antibody (red fluorescence, LC3) and DAPI (blue, cell nuclei). The number of cells with LC3 puncta (n = 10) was determined (left panel). Bars represent mean ± S.E.M. Images are representative of the results obtained in 3 independent experiments (right panel). (B-D) Whole cell lysates were obtained from cells treated with Tnfa, CTnfa, Rapa or 3MA (B) or pre-treated with Rapa for 4 hours and then Tnfa or CTnfa was added for another 4 hours (C, D). LC3-I and LC3-II bands were visualized by WB using an anti-LC3 antibody and the protein content of the stained bands estimated by densitometry. The densitometry values were used to calculate LC3-II/ LC3-I ratios. Actin bands were detected as a protein load internal control using an anti-actin antibody. Data are shown as the mean±S.E.M. of 3 independent experiments. *p<0.05. **p<0.01.

