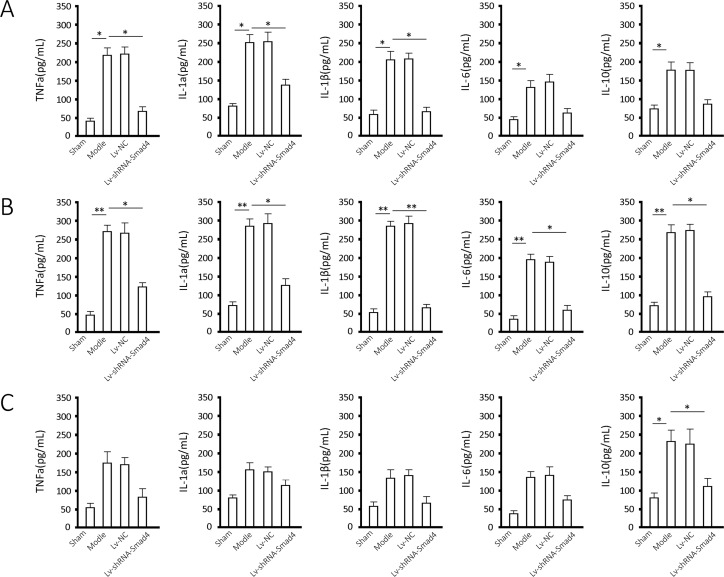
Fig 4. TNFa, IL-1a/β, IL-6 and IL-10 level in Effusion.
Samples were extracted from the joints of rats undergoing the indicated treatment at the end of each month for 3 months (Fig 4A, month 1; Fig 4B, month 2; Fig 4C, month 3) and were measured for TNFa, IL-1a/β, IL-6 and IL-10 using ELISA. The results are shown as the mean ± SD for at least 3 separate experiments. * P < 0.05 and ** P < 0.01 when compared to the indicated group.

