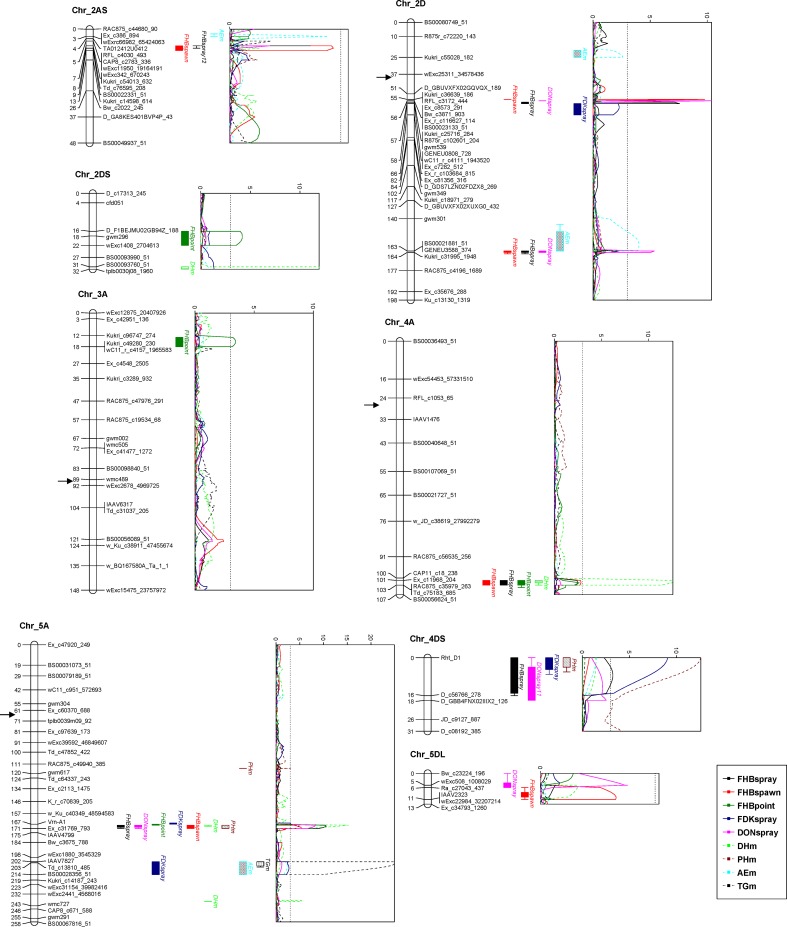
Fig 2. QTL for FHB parameters and their associated traits based on mean phenotypic data.
If there was no QTL detected based on the mean, the environment with significant QTL effect was marked instead, with the year behind the QTL name. Genetic distances are shown in centimorgans to the left of the chromosomes. A threshold of 3.0 is indicated by a dashed vertical line in the LOD graphs. Only framework markers are presented except for the QTL regions. The approximate positions of centromeres are indicated by arrows.

