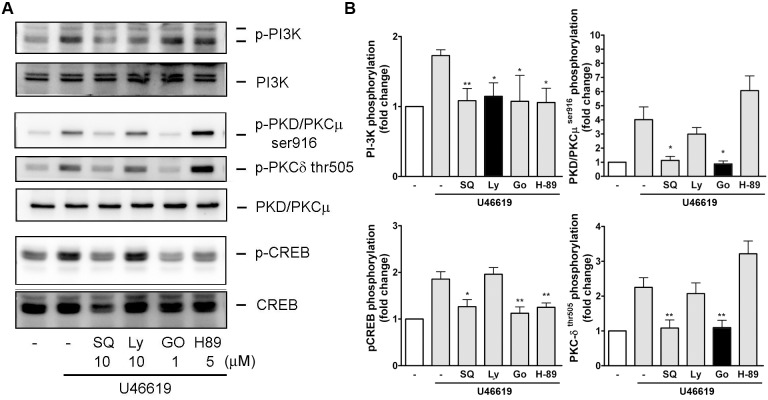
Fig 6. Relationship of PI-3K, PKC, and CREB activation in U44619-induced signaling.
NMDFs were pretreated with SQ29458 (SQ, 10μM), LY294002 (LY, 10 μM), Go6983 (Go, 2 μM), and H-89 (5 μM) for 30 min and followed by stimulation with U46619 (2 μM) for 15 min. (A) A representative blot. (B) Similar results were obtained through densitometry. Data are expressed as mean ± SEM (n = 5–8). *P < 0.05, **P < 0.01 versus U46619 alone.

