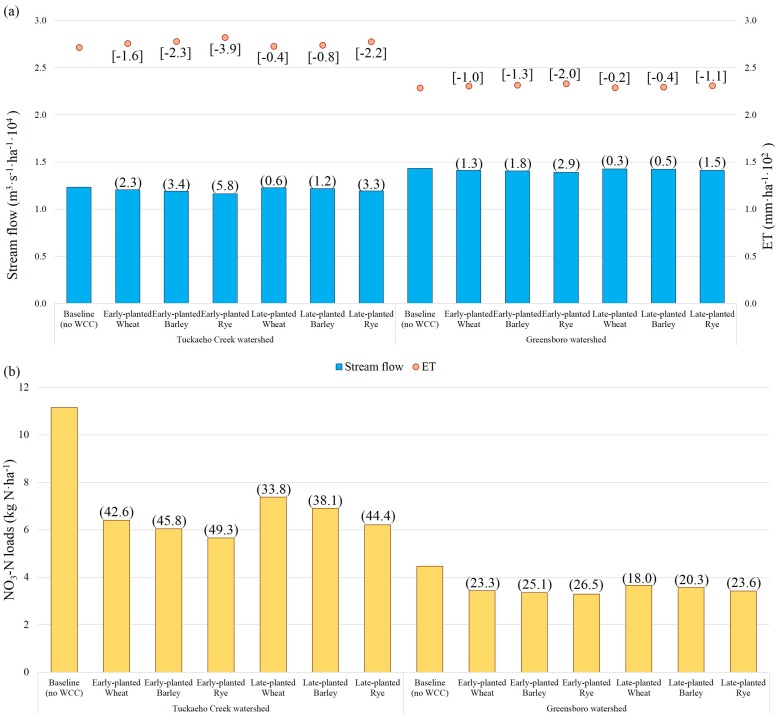
Fig 5. 8-year average of annual hydrologic variables under winter cover crop scenarios at the watershed scale: (a) stream flow and evapotranspiration (ET) and (b) NO3-N loads normalized by the total watershed area.
Note: The numeric values in parentheses ([], (), and ()) indicate reduction rate (RR) of ET, stream flow, and NO3-N loads, respectively. RR is calculated by taking the relative difference in simulation outputs from the baseline and WCC scenarios [RR (%) = (Baseline—WCC Scenario) / Baseline × 100]. S3 Table summarizes the finding from the three way ANOVA for the NO3-N reduction by the watershed, WCC planting timing, and species.

