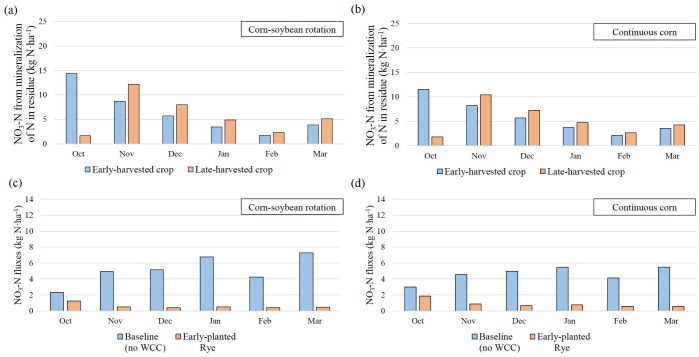
Fig 8. Temporal distribution of 7-year average of (a & b) NO3-N from mineralization of N in residue and (c & d) NO3-N fluxes (delivered to streams and leached into groundwater) in two crop rotations at the cropland scale under early-planted rye scenario over winter seasons (October-March).
Nitrate-N values are normalized by the total croplands used for these two crop rotations. Cumulative values are represented in Fig 7.

