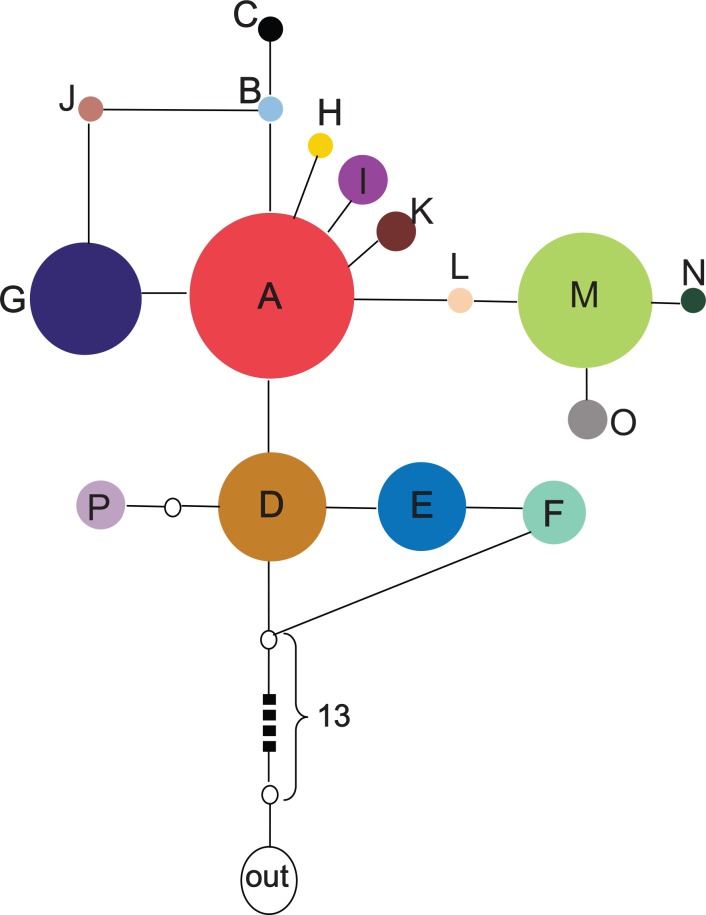
Fig 2. Statistical parsimony network of Ephedra przewalskii cpDNA haplotypes.
The unfilled circles indicate the missing or inferred haplotypes; the circle size is proportional to haplotype frequencies; haplotypes in the network showed in the same colours correspond to those in the geographical distribution, Fig 1.

