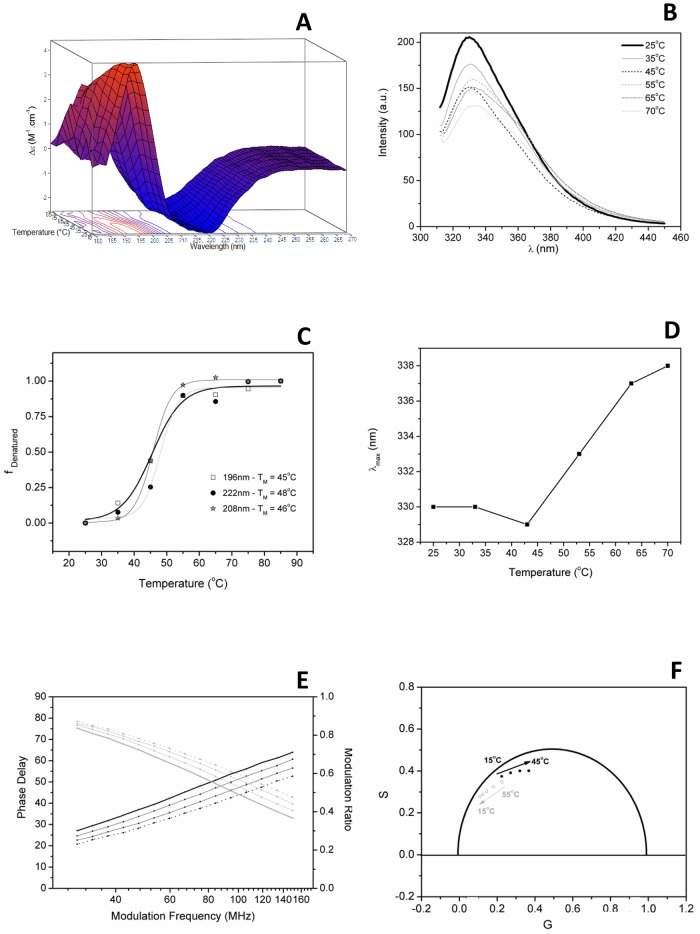
Fig 4. Thermal stability of PmEst evaluated by spectroscopic methods.
a) Synchrotron radiation circular dichroism spectra as a function of temperature overlaid in the Z direction; b) emission spectra of PmEst as a function of temperature in sodium phosphate pH 7.4. c) fluorescence emission maxima data as a function of temperature. d) thermal denaturation curves of PmEst, taken from SRCD data at 196, 208, and 222 nm, and e) Phase delay (bottom curves) and modulation ratio (top curves) of the excited state lifetime of PmEst in PBS as a function of temperature, from 15°C (solid) to 45°C (dot) in10°C steps; and f) their respective phasor diagram, showing the point at 55°C is not on the same trajectory of the other point at below temperatures.

