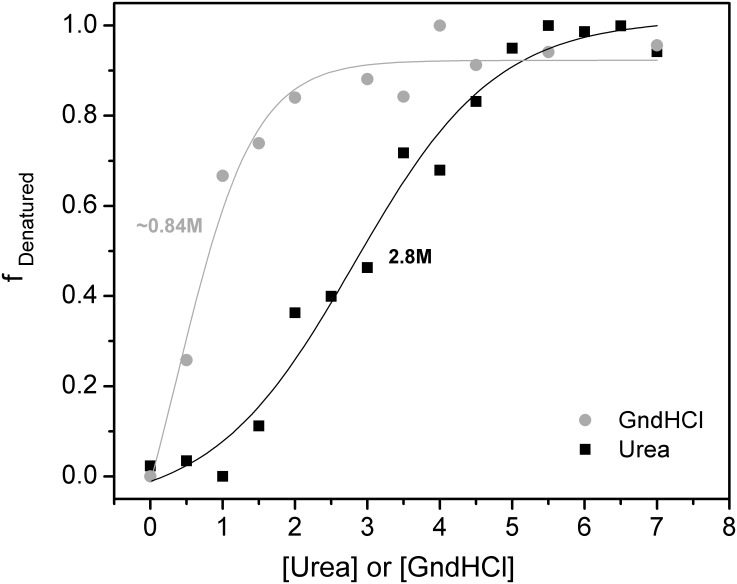
Fig 5. Effect of urea and guanidine on the structure of PmEst.
Curves of the chemical denaturation of PmEst with addition of urea (black) and GndHCl (gray), taken from the normalized ellipticity value at 220 nm of the CD spectrum registered at each condition. Sigmoidal fit was performed on each curve, considering two different states for PmEst: native and denatured.

