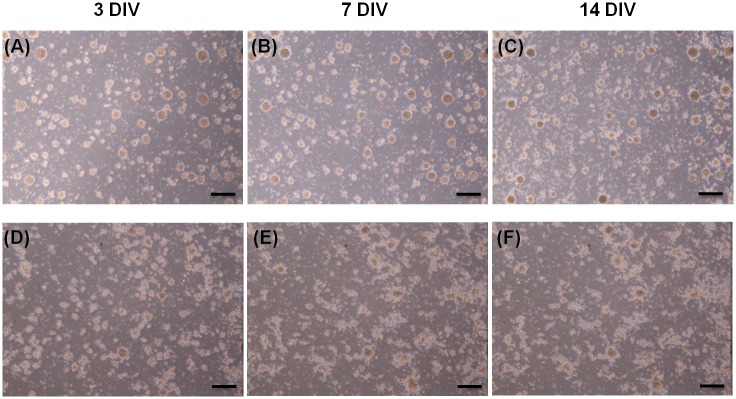
Fig 4. Cell morphology in the control and electrical field (EF) groups after 3, 7, and 14 d in vitro (DIV).
Morphology of mNPCs without EF stimulation (A–C) and after stimulation (D–F) by the DC pulses. The images were taken at 3 DIV (A and D), 7 DIV (B and E), and 14 DIV (C and F). Low-magnification view (×4). Scale bars: 120 μm.

