Abstract
Modeling the molecular mechanisms that govern genetic variation can be useful in understanding the dynamics that drive genetic state transition in quasispecies viruses. For example, there is considerable interest in understanding how the relatively benign vaccine strains of poliovirus eventually revert to forms that confer neurovirulence and cause disease (ie, vaccine-derived poliovirus). This report describes a stochastic simulation model, S2M, which can be used to generate hypothetical outcomes based on known mechanisms of genetic diversity. S2M begins with predefined genotypes based on the Sabin-1 and Mahoney wild-type sequences, constructs a set of independent cell-based populations, and performs in-cell replication and cell-to-cell infection cycles while quantifying genetic changes that track the transition from Sabin-1 toward Mahoney. Realism is incorporated into the model by assigning defaults for variables that constrain mechanisms of genetic variability based roughly on metrics reported in the literature, yet these values can be modified at the command line in order to generate hypothetical outcomes driven by these parameters. To demonstrate the utility of S2M, simulations were performed to examine the effects of the rates of replication error and recombination and the presence or absence of defective interfering particles, upon reaching the end states of Mahoney resemblance (semblance of a vaccine-derived state), neurovirulence, genome fitness, and cloud diversity. Simulations provide insight into how modeled biological features may drive hypothetical outcomes, independently or in combination, in ways that are not always intuitively obvious.
Keywords: picornavirus, replication, recombination, modeling, simulation, genome evolution, genetic state transition, Sabin, Mahoney
Introduction
Poliovirus has been a subject of intense study for more than six decades due to its importance as a public health threat reaching as far back as antiquity.1–3 Many factors identify the difficulties encountered in a global eradication initiative, including the high rates of genetic mutation and recombination during virus replication, as well as observations that vaccination programs have resulted in the evolution of genetic variants that resemble wild-type poliovirus with respect to pathogenicity and neurovirulence.2–4 Several studies have examined the specific nucleotide substitutions that result in phenotypic changes associated with disease in viruses isolated from previously vaccinated populations or individuals.3,5–11 Because genetic variants can persist, continue to evolve, and be shed by individuals for many years, and because the oral vaccine can itself cause disease outbreaks, it is likely that eradication of polio will remain an uncertainty, and continued research is imperative.
Several attempts to model replication in poliovirus and related quasispecies viruses have contributed to a better understanding of virus evolution.12–17 Modeling efforts can focus attention on key biological mechanisms and can inspire hypothesis generation to promote further experimentation.18,19 Whereas all models are abstractions and simplifications of reality, they begin as an attempt to capture the most salient features of a biological system, upon which additional complexity can be built, given experimentation, validation, model refinement, and further development.
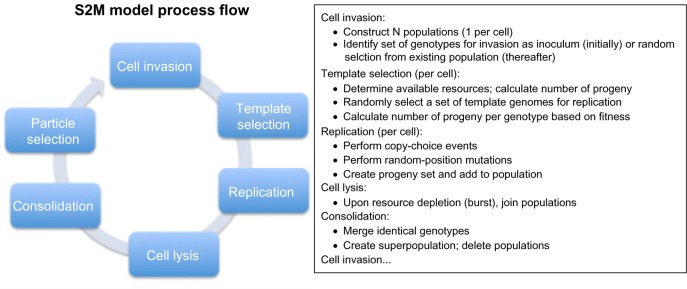
This article describes a stochastic simulation model, called “S2M”, that can be used to simulate genetic state transition from the Sabin-1 (vaccine) strain of poliovirus to intermediate states resembling the Mahoney wild type at specified nucleotide positions. The model simulates mechanisms of genetic variation and tracks genetic changes at nucleotide positions that distinguish Sabin-1 from Mahoney (Fig. 1). Nucleotide positions that resemble neurovirulent or Mahoney sequence are assigned higher values of fitness, thus providing the driving forces for state transition. Values for various default parameters that define constraints on genetic variation were based roughly on values from the literature8 in order to construct a model that would display realism, to the degree that such may be feasible in a limited modeling experiment. Although several reports have investigated mutations5–10 in poliovirus vaccine strains (ie, Sabin genotypes), the data from the study by Georgescu et al.8 were selected due to completeness with respect to a set of mutations that could potentially revert Sabin-1 to a vaccine-derived phenotypic state, perhaps resembling that of the Mahoney wild type. The utility of the model is demonstrated by means of simulation experiments in which the values of several parameters affecting genetic state change are varied, and outcomes are compared.
Figure 1.
High-level view of S2M process flow and mechanisms modeled.
Materials and Methods
Model structure
The S2M model code comprises a library of modules that define data and functionality. Behavior of the model is governed by a set of input parameters (Table 1). A genotype was defined as the 56 nucleotide positions that distinguish the Sabin-1 vaccine strain from the Mahoney wild type or that otherwise confer neurovirulence.8 Limiting the model to 56 positions afforded simulation of the most relevant genetic changes that represent a well-defined genetic state transition, while maintaining constraint on computer memory usage. A population was defined as a set of genotypes replicating within the same cell. Progeny genomes are produced during successive replication cycles within a cell, terminating when the burst size (ie, the sum of parent plus progeny virus particles that have exhausted resources and have filled a cell) (b) is reached (Fig. 2). The initial inoculum is defined as the number of copies (multiplicity) of a fixed-state genotype (eg, Sabin-1). Upon entry, the inoculum genotype set is replicated, with a subset being subjected to homologous (copy-choice)27,28 recombination, according to the recombination rate (r). Each genotype position is subject to random mutation based on the mutational error rate (e). The generational growth rate (g) determines the number of progeny that will be produced from an initial set of replication templates; as such, S2M follows the “geometric replication mode” (progeny in early replication cycles become templates for further replication, thus increasing mutation likelihood), as opposed to the “stamping mode” (all progeny are derived from the original viral RNA that first infected the cell).17 For each subsequent round of replication within a cell, a set of template genotypes is randomly selected from the existing pool (population) of genotypes. Replication proceeds until resources are exhausted (ie, the burst size is reached). Upon burst, all (parent and progeny) genotypes are consolidated within each population to eliminate sequence redundancy in the model; genotypes with identical sequence are combined and the individual counts are summed, and populations (P) are consolidated to yield a super-population (ie, cloud). The subsequent infection cycle (or cell passage) is mediated by random selection of a set of genotypes from the super-population according to the multiplicity of reinfection (i). The “i” parameter attempts to simulate a limitation on the number of cell receptors that enable virus particle entry or the number of initial sites of replication.17 Infection cycles continue until the number of passages (p) has been reached, or until a super-population goes extinct. Extinction is defined to occur when no viable genotype can be selected for subsequent infection. By default, the model replicates defective genotypes (defined as having at least one lethal mutation) and selects them for subsequent infection, but eliminates them from the inoculum (set of infecting particles), thereby simulating inability to infect a cell. These behaviors are controlled by input parameters “l” (to retain lethals throughout in-cell replication) and “f” (filter lethals from infection set). Figure 1 shows an overview of the model structure and summary of the process flow. Randomization is performed using the Mersenne Twister method.29 A simulation experiment may be constructed by specifying in a kernel program (eg, Qspp_main.cpp) an inoculum consisting of a defined initial genotype set and by specifying at the command line any of the parameters listed in Table 1. Numerous statistical measures are recorded and periodically updated throughout the simulation (see Supplementary Files 1, 2, and 3 for sample simulation trace, report, and statistical files, respectively; generation of these files is described below).
Table 1.
Configurable parameters (command-line arguments) and their default values.
| ARGUMENT | DEFAULT | CONFIGURABLE FEATURE | REFERENCE |
|---|---|---|---|
| −e | 0.001 | Replication error rate | 12,20–25 |
| −g | 1.0 | Generational growth rate | 16,17 |
| −r | 0.3 | Homologous recombination rate | 24,26 |
| −b | 1000 | Burst size | 25 |
| −i | 100 | Multiplicity of reinfectiona | |
| −p | 5 | Number of passages | |
| −c | 1 | Generations to consolidate (for memory management) | |
| −P | 5 | Number of populations | |
| −a | 2.0 | Fitness accelerator | |
| −t | 60% | Mahoney threshold | |
| −s | 2.0 | Mahoney mutation synergy | |
| −I | true | Retain lethal mutants throughout replication | |
| −f | true | Filter lethal mutants prior to infection |
Notes: References were consulted in assigning default parameter values, although default values do not necessarily match values found in the literature (“Materials and methods” section).
Multiplicity of reinfection refers to the number of particles infecting cells beginning with the second cell infection cycle.
Figure 2.
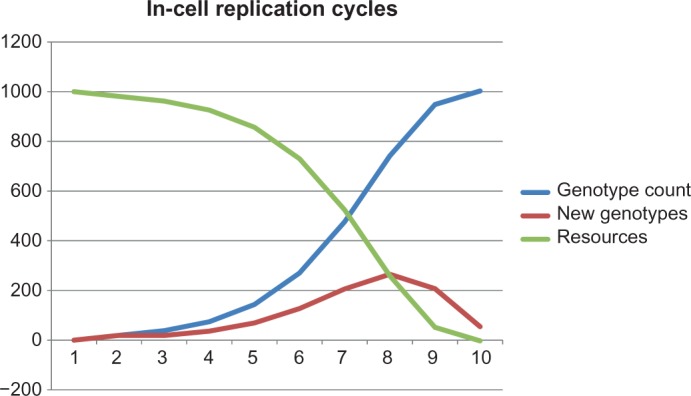
In-cell replicative growth. To illustrate the change in genotype numbers during in-cell replication, a single replication cycle (ie, no passage) was run under default conditions. X-axis is the in-cell replication cycle number (beginning state at 1), and Y-axis is the cumulative number of genotypes (blue), new progeny genotypes (red), and remaining resources represented as potential genotypes (green), at each replication cycle. The inoculum contained 10 genotypes, and the burst size was 1000.
Replication mechanisms and constraints
For each replication cycle, the number of candidate progeny genotypes is calculated as the integer value of n*g*l, where n is the number of genotypes, g is the generational growth rate, and l is a limi ting factor, computed as [(b − n)/b], the fraction of remaining cellular resources. If the sum of genotypes plus progeny exceeds the burst size, then the number of candidate progeny is adjusted to the burst size minus the number of genotypes. Figure 2 shows how in-cell genotype population grows with each replication cycle. The number of parent genotype sequences to undergo homologous (copy-choice) recombination27,28 is calculated as the number of candidate progeny times the recombination rate (r), and the number of simple replications is calculated as the number of progeny minus the number of recombinants. Homologous recombination is achieved by selecting a random position from which to join the 5′ segment of a first genotype to the 3′ segment of a second genotype to form a recombinant candidate progeny genotype. The number of positions to undergo random mutation is based on the replication mutation rate (e), and the candidate progeny genotype positions to be mutated are randomly selected; some or most candidate progeny genotypes may not incur any mutation, whereas some may incur multiple mutations. The genome fitness values for each candidate progeny genotype are then recalculated (ie, updated). Fitness is defined, calculated, and implemented during the replication cycle as described in the “Fitness” section (below). The ultimate set of progeny genotypes is generated from the candidate pool based on relative fitness using two algorithms guided by input parameters “a” (fitness accelerator) and “s” (Mahoney synergy) and is then added to the population’s genotype set. First, the Mahoney fitness factor is calculated for each candidate progeny genotype (“Fitness” section). Then, the final selection of progeny genotypes is calculated by selecting genotypes from a geometric distribution governed by the fitness accelerator (a). The number of copies of each candidate genotype (to be incorporated into the evolving genotype set) is calculated as the rounded integer value of Pi = P*fa/SUM1.n(fia), where Pi is the number of copies of a candidate genotype, P is the total number of progeny to be produced, f is the genotype Mahoney fitness factor raised to the power a (conferring exponential fitness gain)30, where a is the fitness accelerator (a) and the denominator is the sum of each candidate genotype Mahoney fitness factor raised to the power a. By dynamically calculating relative replication fitness in this way, the most “fit” genotypes will tend to add more members to the population than those lesser fit, and the least fit will tend to be eliminated. The “Mahoney boost” (fitness adjustor) or the fitness accelerator can be rendered null by setting the respective input parameter to −99.0 or 1.0.
Fixed-state genotypes
Three fixed-state genotypes (in code file FixedState.h) are defined to guide the model in determining the genotype states comprising Sabin-1-initial genotype, Mahoney resemblance, and neurovirulence. Positions that distinguish the Sabin-1 vaccine strain from the Mahoney wild-type virus or that confer neurovirulence were taken from the study by Georgescu et al.8
Fitness
Genotype fitness is calculated as the sum of fitness values at each position. Two fitness grids are defined in code in the FixedState.h file based on the notion that Mahoney represents a relatively fit genotype, whereas Sabin-1, being an attenuated virus, has reduced fitness. Fitness grid 1 defines relative fitness values at each of the 56 defined positions. Nucleotides with identity in the corresponding position in Mahoney were assigned a fitness value of 0.8, whereas those corresponding to Sabin-1 were assigned 0.2. Neurovirulence positions, having identity in positions corresponding to known neurovirulence mutations, were assigned fitness value 1.0. Remaining nucleotides were assigned “neutral” fitness value 0.5. Fitness grid 2 defines the same fitness values as defined in fitness grid 1, with the exception that in any given position for which there are two nucleotides with neutral fitness, one was assigned a fitness value of 0.0, indicating that the nucleotide at that position confers a lethal mutation. Note that a relatively fit genotype can harbor a lethal mutation, as Boolean lethality is computed separately from quantitative fitness. The Mahoney genotype has fitness 45.5, and the Sabin-1 genotype has fitness 12.2. Based on the notion that Mahoney mutations may be synergistic, upon replication, a genotype Mahoney boost (Mahoney-synergy fitness factor) is calculated as, Fb = 1 + F(ms/n), where F is the genotype fitness, m is the number of Mahoney mutations, s is the Mahoney synergy parameter (s), and n is the number of positions in the genotype (ie, constant 56 in the model). The genotype replication fitness is then calculated as F*Fb, where F is the genotype fitness and Fb is the Mahoney boost.
Model parameters
Table 1 shows the parameters that may be configured by the user. Default settings for certain parameters were set after consulting references listed in Table 1. Mahoney reversion for a population is defined as the decimal fraction of positions in the population (across all genotypes) that are identical to Mahoney sequence. Upon update of genotype statistics, the model assigns the value “neurovirulence = true” if any neurovirulence position has attained neurovirulence identity, and “Mahoney = true” if the genotype has attained 60% (by default) Mahoney identity. Lethal mutants (ie, defective interfering particles) were defined as having at least one position with fitness = 0.0. A “viable” genotype has no position with a lethal mutation (ie, all nucleotide fitness values > 0.0).
Report statistics
Population health was defined as the percentage of genotypes that do not confer a lethal mutation. Population (or cloud) diversity was calculated as the proportion of distinct genotype sequences to the total number of genotypes, expressed as a percentage. Additional statistics relating to in-cell replication, diversity, neurovirulence, and Mahoney resemblance that are provided by the model are listed in Table 2.
Table 2.
Output data values and abbreviations.
| DATA VALUE | DESCRIPTION | ABBREVIATION |
|---|---|---|
| Cloud census | Count of genotypes in the cloud | Pgentyps |
| No. of distinct genotypes | No. of non-redundant genotype sequences | Distinct |
| Range of redundant genotypes | Minimum and maximum genotype counts among non-redundant genotypes | PMinMax |
| Mean genotypes per sequence | Mean number of copies per distinct genotype | PopMean |
| Median genotypes per sequence | Median number of copies per distinct genotype | PopMedn |
| Population diversity | Measure of population diversity (1.100) | Divrsty |
| Population health | Percent of total genotypes without lethal mutation | Health |
| No. of defective genotypes | Number of genotypes with at least one position with zero fitness | Defctvs |
| Average genotype fitness | Fitness averaged over all genotypes | AveFitn |
| Population viability | Viable if population has at least one genotype without a lethal mutation; Extinct if population is empty or all genotypes have at least one lethal mutation | Viablty |
| Generations to burst | Number of replication cycles that occurred in a cell | Gnratns |
| No. of neurovirulent genotypes | Number of genotypes that have at least one neurovirulence mutation | Ngentps |
| Average neurovirulence score | Average neurovirulence score among neurovirulent genotypes | Nscore |
| Average neurovirulence indexa | Average neurovirulence indexa among neurovirulence genotypes | AvNindx |
| No. of Mahoney revertants | Number of genotypes that have attained cutoff percentage of Mahoney mutations (default is 60%) | Mgentyps |
| No. of Mahoney mutations | Total number of Mahoney mutations among genotypes in the population | Mutns |
| Mahoney reversion index | Proportion of Mahoney mutations in the population as a decimal fraction of 1.0 | Revrsn |
Notes: Abbreviation comprises column headers in simulation report files.
Neurovirulence index is a sum of phenotype contributions per position, as determined by the relative strength of the neurovirulence phenotype (see Configurable.h file and Ref. 8).
Memory management
Because only 56 nucleotide positions (which distinguish the Sabin-1 and Mahoney strains or confer neurovirulence) were included in the model, a simple approach to memory management was adequate for running simulations on the hardware used for this work. Following cell burst, S2M eliminates redundant genotypes by merging identical sequences and updating the distinct genotype counts accordingly. This step is called “consolidation” in the model.
Simulations and data processing
The kernel that was written to conduct the study, Qspp_main.cpp, was used to create simulations in which five populations were tracked through 200 cell-to-cell passages. Initially, a simple test of virus replication was performed using fitness grid 1, and all default parameters to track the increase in virus progeny in a single-cell simulation and verify that virus population would increase as expected (ie, exponential growth followed by tapering; Fig. 2). Single-parameter simulation experiments involving five virus populations comprised examinations of the presence versus absence of defective interfering particles (using default Boolean variables) (Fig. 3), variation in the rate of replication error (Fig. 4), variation in the recombination rate (Fig. 5), variation in the fitness accelerator (Fig. 6), and variation in the degree of Mahoney synergy (Fig. 7). Two-parameter simulation experiments examined the dual effects of varying the rates of mutational error and (copy-choice) recombination (Fig. 8A–D). Text output by S2M allows the user to trace in detail the process flow of a simulation (Supplementary File 1 for sample trace). Summary data (Supplementary File 2) were collected from each of the simulation output trace files by saving the text produced by grepping “Report” on the output file (ie, at the command line, type: “grep ‘Report’ S2M.output > myReportFile.tab”). Python code (calculateStats_S2M.py) was used to parse the replicate output report files, compute statistics over the replicate values for each output data value (Table 2), and write these statistics to separate report files. Supplementary File 3 comprises a sample file containing mean values over multiple replicate simulation runs. Unless otherwise indicated, all data shown in plots in this article are mean values computed over 10 replicates.
Figure 3.
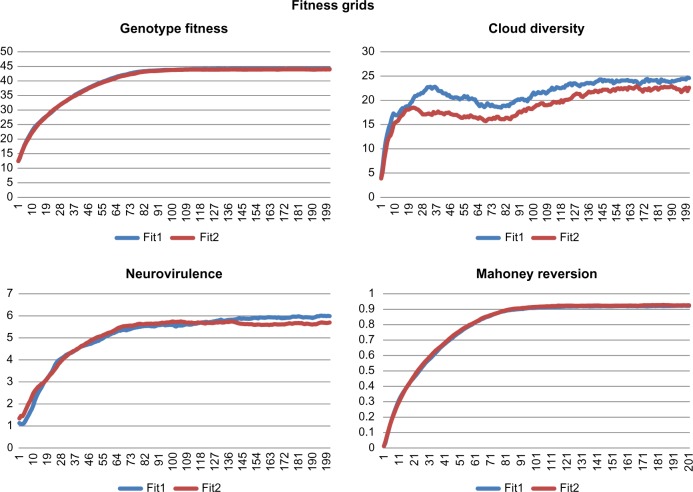
Simulations using default parameters and fitness grids 1 and 2. X-axis indicates the passage numbers. Graph titles indicate quantities shown along the Y-axis. Fit1: fitness grid 1; Fit2: fitness grid 2. Grids 1 and 2 are specified in the kernel program (Qspp_main.cpp).
Figure 4.
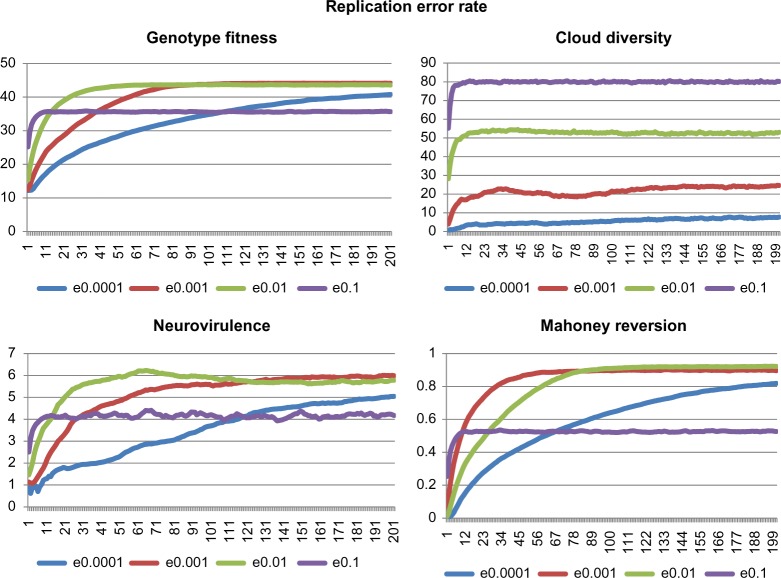
Simulations using fitness grid 1, varying the replication error rate parameter (“e”). X-axis indicates the passage numbers. Graph titles indicate quantities shown along the Y-axis. Colored lines indicate command-line arguments to the model: e0.1 = −e 0.1; e0.01 = −e 0.01; e0.001 = −e 0.001; e0.0001 = −e 0.0001.
Figure 5.
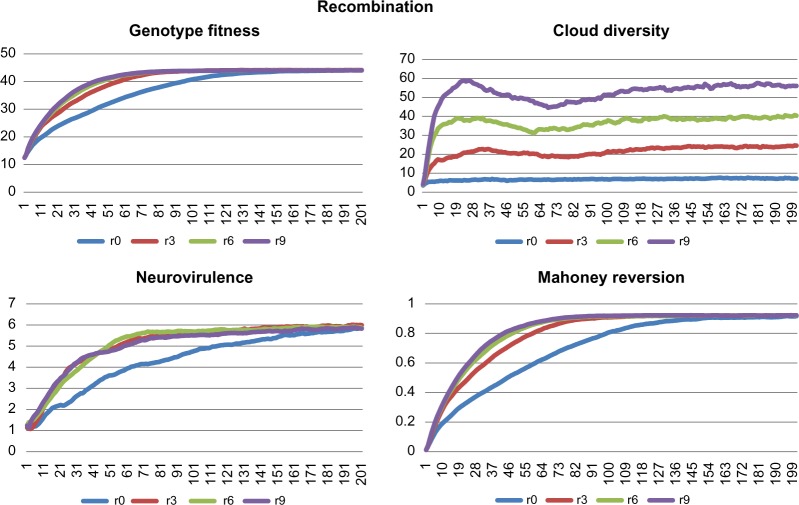
Simulations using fitness grid 1, varying the copy-choice recombination rate parameter (“r”). X-axis indicates the passage numbers. Graph titles indicate quantities shown along the Y-axis. Colored lines indicate results generated by the model run with command-line arguments: r0 = −r 0.0; r3 = −r 0.3; r6 = −r 0.6; r9 = −r 0.9.
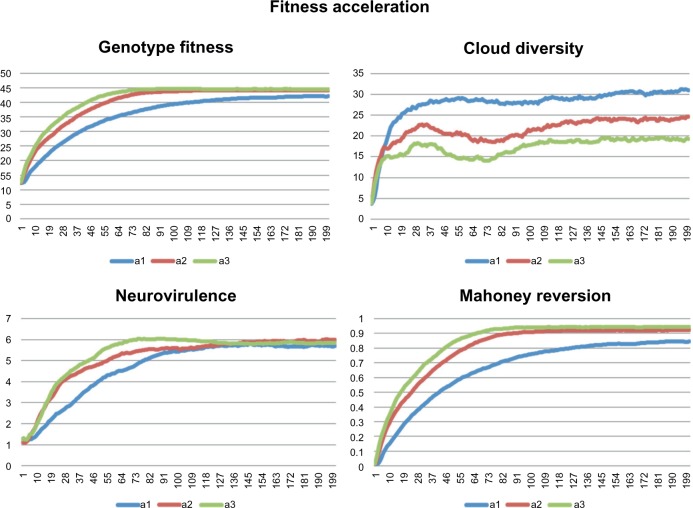
Figure 6.
Simulations using fitness grid 1, varying the fitness acceleration parameter (“a”). X-axis indicates the passage numbers. Graph titles indicate quantities shown along the Y-axes. Colored lines indicate results generated by the model run with command-line arguments: a1 = −a 1.0; a2 = −a 2.0; a3 = −a 3.0.
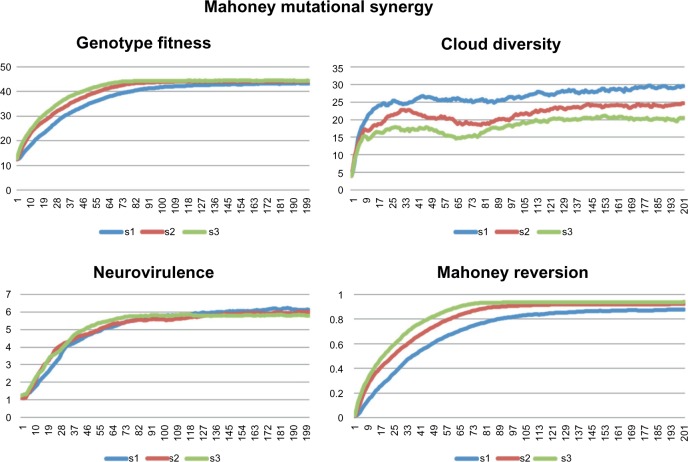
Figure 7.
Simulations using fitness grid 1, varying the Mahoney mutational synergy parameter (“s”). X-axis indicate the passage numbers. Graph titles indicate quantities shown along the Y-axis. Colored lines indicate results generated by the model run with command-line arguments: s1 = −s 1.0; s2 = −s 2.0; s3 = −s 3.0.
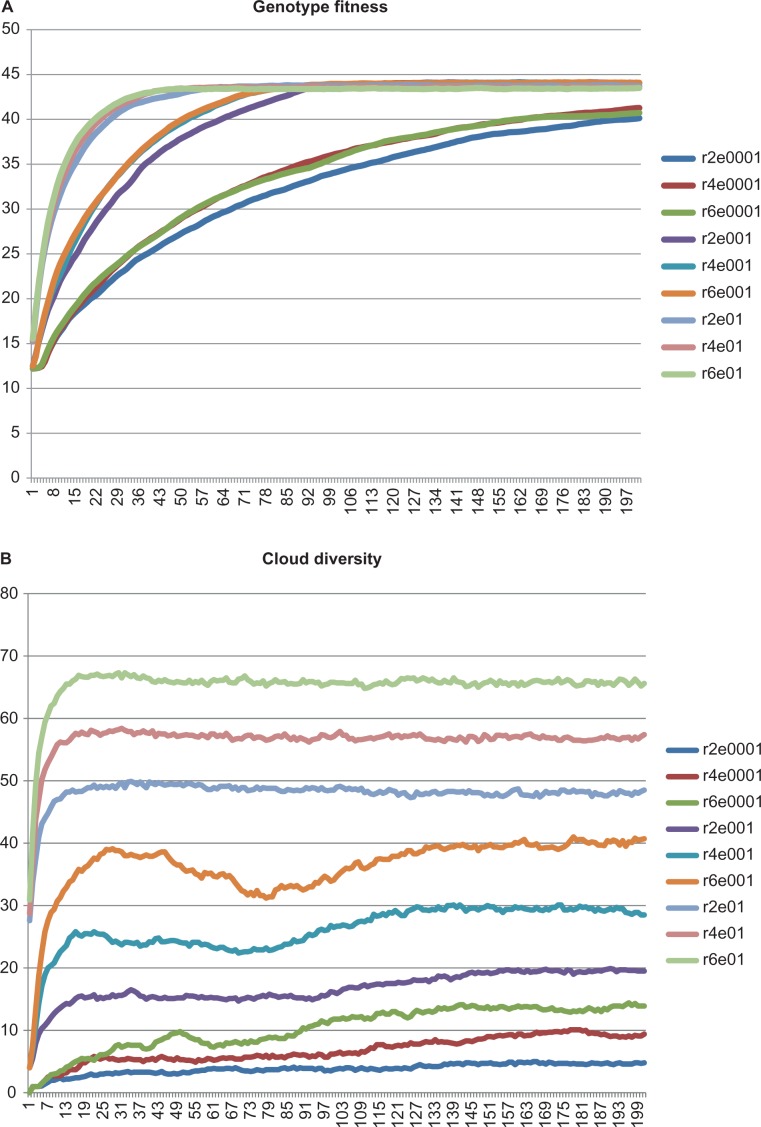
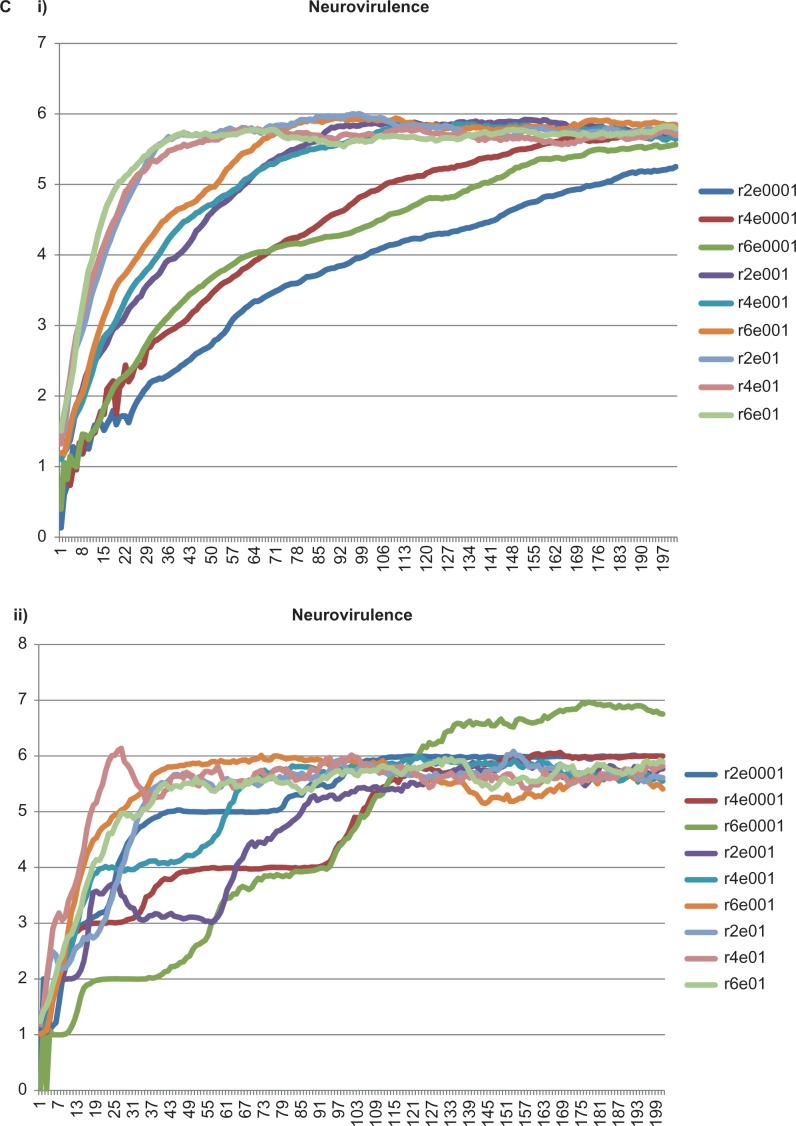
Figure 8.
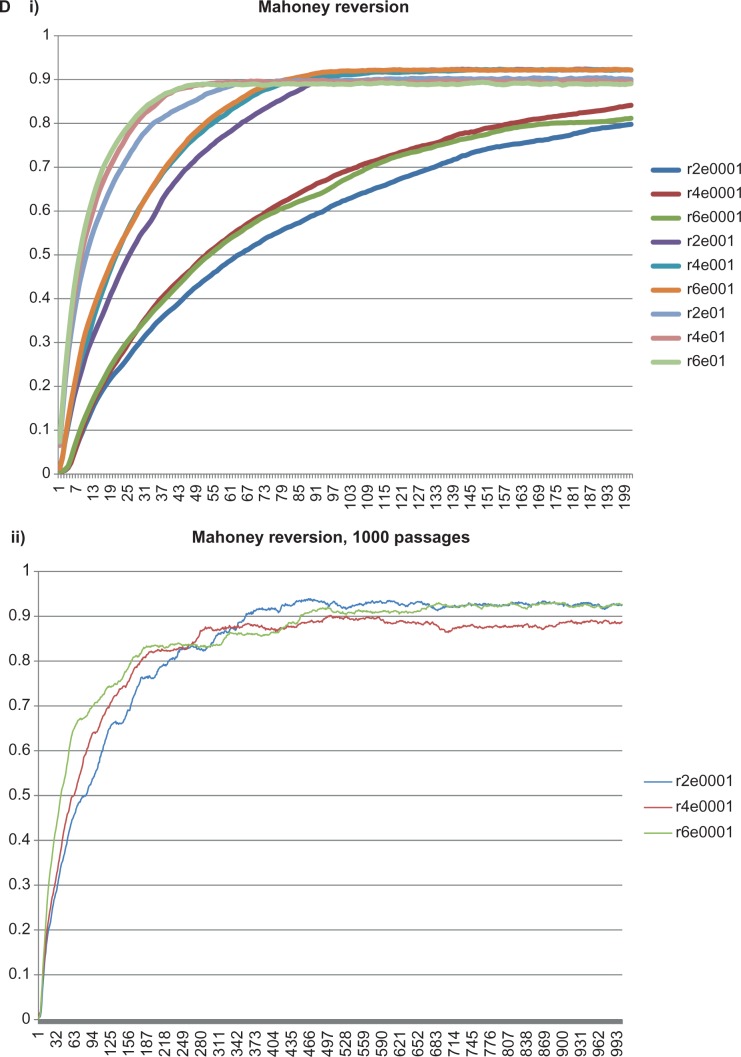
Two-parameter simulations using fitness grid 1, varying the replication error rate (“e”) and the recombination rate (“r”). X-axis indicates the passage numbers: A, B, C1, C2, D1; number of passages = 200; (D2) number of passages = 1000. Graph titles indicate quantities shown along the Y-axis. Colored lines indicate results generated by the model run with command-line arguments: r2e0001 = −r 0.2 –e 0.0001; r4e0001 = −r 0.4 –e 0.0001; r6e0001 = −r 0.6 –e 0.0001; r2e0001 = −r 0.2 –e 0.001; r4e0001 = −r 0.4 –e 0.001; r6e0001 = −r 0.6 –e 0.001; r2e0001 = −r 0.2 –e 0.01; r4e0001 = −r 0.4 –e 0.01; r6e0001 = −r 0.6 –e 0.01. C2 and D2 are single-replicate tests.
Code execution
C++ codes were compiled using Xcode v. 6.2 and executed at the command line in a Linux interface on an Apple Macbook computer running OSX v. 10.9.5. Command strings were of the form, “./Qspp_main.exe [< parameter> <value >]n> simulation.out”, where n represents the number of arguments passed to the kernel program, “parameter” is an argument symbol provided at the command line to modify the defaults (Table 1), and “value” is the override for that parameter. Simulation output files were post-processed on the same machine, and mean values were plotted using Microsoft Excel.
Results
Single-parameter simulations
Lethal mutations
The effects of the presence versus absence of genotypes with at least one lethal mutation were studied. Figure 3 shows that the presence of lethal mutant genotypes (fitness 2) did not affect fitness or the accumulation of Mahoney reversion mutants compared to the simulation in which lethal genotypes were absent altogether (fitness 1) and had a small effect on the accumulation of neurovirulent genotypes. Initially, lethal mutations appeared to increase the number of neurovirulent genotypes, but over time this difference resolved, and after passage 140, the number of neurovirulent genotypes was greater in the simulations using fitness 1 (no lethals). Cloud diversity was observed to be slightly greater in the simulation using fitness 1, indicating that the effect that lethal mutations had on diversity was small but detectable under the simulation conditions.
Replication error rate
The rate at which mutations were to be generated at each replication cycle was varied over four orders of magnitude. Although this range of replication error rates was in exaggeration, its purpose was to detect behavioral differences of the model based on significant changes in this parameter within 200 passages. Behaviors regarding Mahoney reversion, neurovirulence, and genotype fitness were similar in that in all three cases the greatest replication error rate resulted in a rapid increase in the phenotype being detected, but the long-term frequencies of each phenotype differed, being lower for larger values of replication error rate (Fig. 4). For each mutation rate, cloud diversity rose rapidly and stabilized early in the simulation. Cloud diversity was greatly influenced by the rate of replication error, with the highest rate yielding the greatest diversity, and the lowest yielding little diversity over 200 passages.
Homologous (copy-choice) recombination rate
The recombination rate was varied from 0.0 (no recombination) to 0.9 (90% of replicating templates undergo recombination). Increasing the rate of recombination resulted in an increase in the number of passages required to achieve end-state values for Mahoney reversion, neurovirulence, and fitness, up to r = 0.6, but initial and end-state values did not differ greatly upon increasing the recombination rate to r = 0.9 (Fig. 5). Cloud diversity rose rapidly at all levels of positive recombination rate, but quickly stabilized following an initial oscillation (approximately passages 25–115).
Fitness acceleration
Increasing the fitness acceleration was expected to enhance the rates at which genotypes with neurovirulent and Mahoney resemblance phenotypes would accumulate in a population. Figure 6 illustrates that the highest accelerator yielded the most rapid accumulation of both phenotypes. However, even though the factors for these fitnesses increased at greater than linear degrees (“Materials and Methods” section), the greatest increases were seen between the lower and middle values; there was a tapering of the effect as the value of the parameter was increased. However, extrapolation of the curves suggested that end states of Mahoney reversion and neurovirulence were equivalent. Genotype fitness also followed these patterns. However, in the long term, diversity decreased with increasing fitness acceleration.
Mahoney mutational synergy
Mahoney synergy (Fig. 7) had small, but detectable, effects on Mahoney reversion, neurovirulence, and genotype fitness, following the patterns of fitness acceleration (Fig. 6), with the most pronounced effect being on Mahoney reversion. Lower values of Mahoney synergy resulted in increases in end-state diversity.
Two-parameter simulations: replication error rate and recombination rate
The effects on genotype fitness (Fig. 8A) of simultaneously varying the replication error (e) and recombination (r) rates revealed that both mechanisms had similar contributions in that increasing either resulted in increases in the rates at which steady-state fitness was achieved. For constant e = 0.0001 or e = 0.001, higher values of r produced a more rapid rise in fitness (Fig. 8A dark olive and medium orange lines). However, at constant e = 0.01 (Fig. 8A, lightest lines), increases in r had little or no effect on the rate of fitness increase. Similarly, steady-state cloud diversity (Fig. 8B) increased markedly with each increase in either e or r, as these mechanisms worked synergistically to increase cloud diversity; the highest values for both e (0.01) and r (0.6) (Fig. 8B, lightest lines) resulted in the highest degrees of cloud diversity achieved at steady state. However, unlike the fitness test shown in Figure 8A, steady-state cloud diversity at high e (0.01) (Fig. 8B, light lines) was markedly influenced by increasing r. Transitions toward increased neurovirulence were accelerated with increasing values of either r or e (Fig. 8C1), although oscillations introduced by recombination caused the curves to cross over at several points (eg, passage 70, dark red and dark green lines in Fig. 8C1). Measures of neurovirulence were observed to be highly oscillatory in single-replicate tests (Fig. 8C2), with the greatest degree of oscillation being observed at values of e = 0.0001 and r = 0.6. Although averages computed over 10 replicates showed that neurovirulence progressed toward a common steady-state value (Fig. 8C1), potential for delayed or sudden and sustained increases in neurovirulence could be achieved within individual simulations (Fig. 8C2, r6e0001). In addition, within 200 passages, the highest value (approximately 6.9) was observed at the highest rate of recombination (r = 0.6) and lowest rate of replication error (e = 0.0001). The Mahoney reversion test (Fig. 8D1) was qualitatively similar to the genotype fitness test (Fig. 8A) in all respects: increasing values for e and r increased the rates at which steady-state Mahoney reversion indexes were achieved, with r influencing Mahoney reversion more strongly at lower values for e (Fig. 8D1, darkest lines). Unexpectedly, for Mahoney reversion and genotype fitness measures that were averaged from 10 replicates over 200 passages, the most rapid movement toward steady state was observed at r values of 0.4 when e was fixed at 0.0001 (red lines in Fig. 8A and 8D1).
Discussion
Model parameters and fitness grids
Default model parameters for the replication error rate, recombination rate, and burst size (Table 1) were assigned after consulting literature values, but with additional considerations. Because in all cases these values vary greatly in the literature among quasispecies viruses, including polio,12,20–23,25,26 it would be unreasonable to insist upon specific values for any of them. Thus, S2M’s default replication and recombination rates were set at relatively high levels for convenience in conducting tests that would produce meaningful output within 200 cell-to-cell infection cycles, or passages (“p” parameter). However, default parameter values can be changed by modifying constants defined in the Configurable.h file of S2M. Although fitness values were defined arbitrarily and scaled from 0.0 to 1.0 based on the notion that neurovirulence and Mahoney mutations confer greater fitness than do other nucleotide substitutions, the user could use alternate fitness values by defining additional fixed-state genotypes in file FixedState.h. Nucleotide positions that distinguish Sabin from Mahoney were taken from the work by Georgescu et al.8 due to the thoroughness with which these mutations had been described, although, likewise, alternate positions and associated fitness values could be modified by defining additional fixed-state genotypes in file FixedState.h. The default generational growth rate was set at 1.0, and a smooth increase in genotypes was observed during the first cell infection cycle at initial infection using 10 initial genotypes (Fig. 2). A multiplicity of reinfection of 100 (ie, 100 genotypes are selected for each subsequent cell infection) yielded on average an approximately 5-generation separation of progeny from initial templates (data not shown), as was observed experimentally in a study by Schulte et al.17
Fitness grids 1 and 2 were compared (Fig. 3) in order to study outcomes between simulations involving the presence (fitness2) versus absence (fitness1) of lethal mutations. Few or no differences were observed for genotype fitness, neurovirulence, or Mahoney reversion between tests using each of the two fitness grids. Because genotypes conferring at least one lethal mutation were eliminated prior to each subsequent cell-to-cell infection cycle, they were absent from the initial pool of candidate replicating genotypes. In this way, each cell cycle initially involved only nonlethal parent genotypes. The lower degree of cloud diversity observed for fitness grid 2 suggests that the removal of lethal-mutation-containing genotypes decreased the diversity of replicating genotypes, which affected the cloud diversity at the end of each cell cycle.
Simulations
Single-parameter simulations (Figs. 4–7) illustrate the dynamics of varying four parameter settings [replication error rate (e), homologous recombination (r), fitness acceleration (a), and Mahoney mutational synergy (s)] on short-term and steady-state values of genotype fitness, cloud diversity, neurovirulence, and Mahoney reversion. As one might expect, increasing e (0.1, purple line in Fig. 4, Genotype Fitness graph), resulted in a rapid increase in genotype fitness, followed by a steady-state value that was relatively low (approximately 35) compared to values achieved at lower values for e (40 or greater). It stands to reason that outcomes will be attained more quickly at higher e, but that genotype fitness would be constrained by back mutation (instability) in the genotype sequence. Similar effects were observed in the tests involving neurovirulence and Mahoney reversion (Fig. 4). Cloud diversity was driven and maintained similarly at increasingly higher levels by increasing e (Fig. 4) or r (Fig. 5). The work by Vignuzzi et al.31 demonstrates that genomes expressing the G64S mutant polymerase, comprising high-fidelity replicating genomes (ie, low mutation rate), yield descendent populations with lower diversity even after prolonged passaging, which is in agreement with the simulated results from S2M (Fig. 4). Further comparing the behaviors of increasing r versus e, steady-state values for genotype fitness and neurovirulence converged to common values (within 200 cell-to-cell cycles) for r (Fig. 5) but not for e (Fig. 4), suggesting that high replication error rates contributed to long-term sequence instability, whereas recombination events generally did not.
Fitness acceleration was devised in this work as a means by which a genome of greater fitness could be favored during replication, and its prominence in the population “accelerated”, leveraging the notion that cumulative mutations that confer fitness should promote more efficient replication. Replicative (ie, dynamically calculated) fitness gain was thus modeled in S2M as exponential increases, which are supported by observations of virus replication.30 The results in Figure 6 demonstrate that increasing levels of fitness acceleration drove populations toward steady-state endpoints more rapidly, excepting for cloud diversity, in which case the rates to achieve steady state differed little, and diversity was apparently diminished by overrepresentation of the genotypes with the greatest fitness. This implies that maximal consensus genotype fitness may be achieved at the expense of cloud diversity.
Mahoney mutational synergy was devised in this work as a means by which a population could be driven toward an end-state consensus sequence by a hypothetical environmental constraint. By simulating synergy among Mahoney mutations in a given genotype, Mahoney synergy increased the likelihood that a genotype would undergo replication (“Materials and Methods” section). Because the Mahoney genotype was considered highly fit (“Materials and Methods” section), and because it included most (five of seven) of the neurovirulence mutations included in this work (see FixedState.h file), the genotype fitness and neurovirulence simulations (Fig. 7) showed (not unexpectedly) that these outcomes tracked closely with increases in Mahoney synergy. As was observed with fitness acceleration (Fig. 6), steady-state cloud diversity was diminished at higher levels of Mahoney mutational synergy, likely due to overrepresentation of Mahoney-like genotypes (Fig. 7).
Two-parameter simulations (Fig. 8) enabled a study of the combined effects of two mechanisms of genetic diversity: replication error rate and recombination rate. Not surprisingly, neurovirulence increased in an oscillatory manner, especially at lower values of replication rate (Fig. 8C2), due to the relatively few positions that conferred neurovirulence and to their distribution along the genotype sequence; sudden jumps in neurovirulence were presumed to have been caused by the uniting of neurovirulent genome segments during a recombination event, which in turn would create a more highly fit progeny genotype, which would then be favored in the ensuing replication cycles. When the replication error rate was set to its lowest value (0.0001), recombination was assumed to have been the dominant force of genetic variation. Thus, recombination could on occasion (ie, by random chance) be a mechanism for rapidly driving a population toward neurovirulence. As discussed in a study by Duggal et al.24, genetic recombination is an important strategy for eliminating detrimental (or in this case, perhaps, increasing favorable) mutations and ensuring greater genetic diversity. That the combined effects of simultaneously increasing the rates of replication error and recombination yielded little or no synergy in producing long-term (passage 200) fitness (Fig. 8A) or Mahoney reversion (Fig. 8D1) at the highest levels for both parameters implies that at some point neither mechanism had increased influence on the increases in levels of genetic diversity, and the highest rates of genetic variability tended to reduce long-term fitness and Mahoney reversion. The observation that the middle value for rate of recombination (r = 0.4) yielded higher measures of Mahoney reversion (Fig. 8D11) and genotype fitness (Fig. 8A) than did the highest (r = 0.6) or lowest (r = 0.2) at the lowest replication error rate (e = 0.0001) was unexpected, and it may suggest that 10 replicates were too few to ensure adequate averaging of these measures, arising from stochastic processes. However, when the number of passages was increased to 1000, the middle (r = 0.4) Mahoney reversion measure approached a steady-state value lower than either the highest (r = 0.6) or the lowest (r = 0.2), as shown in Figure 8D2. This suggests that long-term genetic outcomes may be influenced by early recombination events.
Fitness
A discussion of fitness as defined in S2M is warranted, given that “fitness” is a variously interpreted concept. In S2M, fitness at the nucleotide level reflects the degree to which a nucleotide individually contributes to the tendency for a genome to compete in replication. This tendency is an indirect representation of environmental conditions that favor certain mutations: Mahoney sequence is presumed to be more fit than is the Sabin-1, and neurovirulence mutations are considered to be more fit than nonvirulence-associated mutations (as vaccine-derived polio viruses often are neurovirulent). The naïve assumption was that each nucleotide behaves independently, and the “simple” fitness of a genome (or “genotype” in the model) was calculated as the sum of the fitness values of its nucleotide positions. Similarly, the fitness of a population or cloud was calculated as the mean of the simple fitness values of its member genomes. Thus, population fitness reflected the degree to which the virus had transitioned toward a more fit state as defined in S2M.
But a definition of genome fitness with more utility for modeling the state transition involves the notion that individual mutations with greater than average fitness are synergistic when they occur on the same genome. In S2M, the fitness accelerator was a dynamic recalculation of a genome’s fitness based on additional considerations. One characteristic that accelerated a genome’s fitness was the accumulation of mutations each with relatively high individual fitness. Although the model considered each nucleotide to behave independently, the accumulation of nucleotides with greater than average fitness resulted in a greater than linear increase in a genome’s ability to compete with respect to replication. In a sense, this is a simulation of mutations working in concert (ie, not independently) to push a genome toward a more fit state. This is distinct, however, from compensating mutations, which comprise pairs or small groups of mutations, or “second-site mutations”, that are functionally linked, which were not modeled in S2M. Likewise, the Mahoney synergy was based on the notion that the nucleotides that comprise Mahoney sequence will behave in concert to increase overall genome fitness and hasten transition toward a more fit state by means of increased propensity to replicate.
In a real biological system, one could not discuss total fitness without considering other biological characteristics, such as replicase processivity, cell receptor attachment, ability to be internalized into the host cell, efficiency of genome packaging, or durability of virus particles in an extracellular environment. The definition of fitness in a computational model would necessarily be expanded upon implementation of any of these additional biological considerations.
Model limitations and extension
S2M is a simple model for studying outcomes driven by factors that influence genome replication and genetic variability. S2M specifically addresses genetic state transition, simulating transition of the Sabin-1 genotype to intermediate Mahoney-like states representing vaccine-derived poliovirus, although the code library could be adapted to model other genomic state transitions, or used as a general model of picornavirus replication, given appropriate fitness constraints. S2M simulates cell invasion, in-cell genome replication, genetic variation afforded by random single-nucleotide mutation and homologous (copy-choice) recombination, resource limitation, cell lysis, release into the medium, and subsequent reinfection (Fig. 1). Because poliovirus replication generally leads to cell lysis under culture conditions,11 S2M was constructed to model burst. However, minor code modifications could yield a model to simulate persistent infection, whereby budded virus (genotypes) would be subtracted from a cell population and added to a cloud. S2M does not model details of virus or cell structure or biology, nor does it model mechanistic details of replication (eg, ribosome binding, mutations involving transition versus transversion), favored recombination breakpoints,32 or rates at which any process occurs. Furthermore, S2M simulations are driven by a predefined, fixed end state, whereas a most compelling next step in modeling genetic state transition might involve adaptation to dynamic environmental forces, such as migration through specific host tissues11,33 or pressures imposed by the host immune system. Additional improvements that could enhance S2M’s utility might include incorporation of measures of Hamming distance from the initial or end-state genotypes (enabling a more quantitative tracking of genetic transition) and a mathematical definition of robustness, which could take into account the mutational distances that genotypes of equivalent fitness may need to traverse in order to attain a given end state.34 Furthermore, the Sabin-to-Mahoney transition as modeled here represents a sample state transition, although there is no reason (other than limitations in data quality and quantity) that the model could not be adapted to any desired state transition consistent with the model’s structure, or used to model coinfection of closely related viruses.
S2M may be unique, as the author is not aware of any published model that simulates in-cell replication followed by cell-to-cell infection over many generations. S2M has a simple design, yet provides a versatile simulation capability. The S2M library modules could be rearranged in writing a kernel that would simulate, for example, spread of the virus from a single infected cell to multiple surrounding cells and beyond. Such a simulation suggests the use of parallel computing and would be entirely feasible, given the S2M code library. Much more detail could be incorporated as well, but S2M embodies a minimal approach to a complex problem in an endeavor to critically examine mechanisms and relationships. Fixed-state genotypes are defined in code, but a programmer could readily insert additional fixed-state genotypes in the FixedState.h file and modify certain classes to accommodate additional state changes or genotype features. In addition, S2M could be used as an educational tool to illustrate picornavirus replication dynamics.
Code design and availability
The S2M model code was written in C/C++ with modules representing genotypes, virus populations, and the quasispecies cloud, as well as modules for specifying static genotypes and configurable features. Efficient memory usage was incorporated into the design so that the model could be executed in a personal computer and would therefore be accessible to the average computational biologist. However, the model is sufficiently versatile that complex simulations could be constructed and run in parallel on supercomputers. S2M includes a postprocessing code, specific to the S2M kernel used for simulations in this work, written in Python 2.7. All S2M source codes are open source offered through a General Public License and are available for academic use at https://www.github.com/carolzhou/Virus/. To access the code, one should first download and install the Git client (see https://git-scm.com/downloads). The project files can be cloned either using the graphical user interface or more simply from the command line (once the software is installed, typing “git” should display a help menu). S2M files can then be downloaded by entering, “git clone https://github.com/carolzhou/Virus”. S2M codes can also be downloaded from SourceForge at https://sourceforge.net/projects/qspp-modeling/.
Supplementary Material
Supplementary File 1. Simulation trace for Qspp_main simulation using fitness1 grid and default parameters.
Supplementary File 2. Report extracted at the command line from S1 simulation trace via “grep ‘Report’”.
Supplementary File 3. Mean values generated by calculate_S2M.py for a 10-replicate fitness1 default simulation.
Acknowledgments
The author is grateful to Dr. Raul Andino and Dr. Tanya Vassilevska for helpful discussions and to Dr. Vassilevska for suggesting the use of the Mersenne Twister for reliable randomization and for acquiring initial funding for a project during which the author wrote some of the S2M code. Acknowledgment is due to Agner Fog for randomization code offered at http://www.agner.org/random/.
Footnotes
ACADEMIC EDITOR: Thomas Dandekar, Associate Editor
PEER REVIEW: Four peer reviewers contributed to the peer review report. Reviewers’ reports totaled 1,712 words, excluding any confidential comments to the academic editor.
FUNDING: This work was funded by the Lawrence Livermore National Laboratory LDRD program, as Computation 08-ERD-036, under Lawrence Livermore National Security contract DE-AC52-07NA27344. The author confirms that the funder had no influence over the study design, content of the article, or selection of this journal.
COMPETING INTERESTS: Author discloses no potential conflicts of interest.
Paper subject to independent expert blind peer review. All editorial decisions made by independent academic editor. Upon submission manuscript was subject to anti-plagiarism scanning. Prior to publication all authors have given signed confirmation of agreement to article publication and compliance with all applicable ethical and legal requirements, including the accuracy of author and contributor information, disclosure of competing interests and funding sources, compliance with ethical requirements relating to human and animal study participants, and compliance with any copyright requirements of third parties. This journal is a member of the Committee on Publication Ethics (COPE). Provenance: the author was invited to submit this paper.
Author Contributions
Compiled information from the literature pertaining to neurovirulence and Sabin versus Mahoney mutations, wrote the S2M C++ and Python codes, performed the simulations, prepared the tables and figures, interpreted the results, and wrote the article: CLEZ. The author reviewed and approved of the final manuscript.
REFERENCES
- 1.Leveque N, Semler BL. A 21st century perspective of poliovirus replication. PLoS Pathog. 2015;11:e1004825. doi: 10.1371/journal.ppat.1004825. [DOI] [PMC free article] [PubMed] [Google Scholar]
- 2.Dunn G, Klapsa D, Wilton T, Stone L, Minor PD, Martin J. Twenty-eight years of poliovirus replication in an immunodeficient individual: impact on the global polio eradication intiative. PLoS Pathog. 2015;11:e1005114. doi: 10.1371/journal.ppat.1005114. [DOI] [PMC free article] [PubMed] [Google Scholar]
- 3.Minor PD. The polio-eradication programme and issues of the end game. J Gen Virol. 2012;93:457–74. doi: 10.1099/vir.0.036988-0. [DOI] [PubMed] [Google Scholar]
- 4.Iwasa Y, Michor F, Nowak MA. Virus evolution within patients increases pathogenicity. J Theor Biol. 2005;232:17–26. doi: 10.1016/j.jtbi.2004.07.016. [DOI] [PubMed] [Google Scholar]
- 5.Christodoulou C, Colbere-garapin F, Macadam A, et al. Mapping of mutations associated with neurovirulence in monkeys infected with Sabin 1 poliovirus revertants selected high temperature. J Virol. 1990;64:4922–9. doi: 10.1128/jvi.64.10.4922-4929.1990. [DOI] [PMC free article] [PubMed] [Google Scholar]
- 6.Equestre M, Genovese D, Cavalieri F, Fiore L, Santoro R, Perez Bercoff R. Identification of a consistent pattern of mutations in neurovirulent variants derived from the Sabin vaccine strain of poliovirus type 2. J Virol. 1991;65:2707–10. doi: 10.1128/jvi.65.5.2707-2710.1991. [DOI] [PMC free article] [PubMed] [Google Scholar]
- 7.Famulare M, Chang S, Iber J, et al. Sabin vaccine reversion in the field: a comprehensive analysis of Sabin-like poliovirus isolates in Nigeria. J Virol. 2016;90:317–31. doi: 10.1128/JVI.01532-15. [DOI] [PMC free article] [PubMed] [Google Scholar]
- 8.Georgescu MM, Balanant J, Macadam A, et al. Evolution of the Sabin type 1 poliovirus in humans: characterization of strains isolated from patients with vaccine-associated paralytic poliomyelitis. J Virol. 1997;71:7758–68. doi: 10.1128/jvi.71.10.7758-7768.1997. [DOI] [PMC free article] [PubMed] [Google Scholar]
- 9.Martin J, Dunn G, Hull R, Patel V, Minor PD. Evolution of the Sabin strain of type 3 poliovirus in an immunodeficient patient during the entire 637-day period of virus excretion. J Virol. 2000;74:3001–10. doi: 10.1128/jvi.74.7.3001-3010.2000. [DOI] [PMC free article] [PubMed] [Google Scholar]
- 10.Stanway G, Hughes PJ, Mountford RC, et al. Comparison of the complete nucleotide sequences of the genomes of the neurovirulent poliovirus P3/Leon/37 and its attenuated Sabin vaccine derivative P3/Leon 12a1b. Proc Natl Acad Sci U S A. 1984;31:1539–43. doi: 10.1073/pnas.81.5.1539. [DOI] [PMC free article] [PubMed] [Google Scholar]
- 11.Blondel B, Duncan G, Couderc T, Delpeyroux F, Pavio N, Colbere-Garapin F. Molecular aspects of poliovirus biology with a special focus on the interactions with nerve cells. J Neurovirol. 1998;4:1–26. doi: 10.3109/13550289809113478. [DOI] [PubMed] [Google Scholar]
- 12.Comas I, Moya A, Gonzalez-Candelas F. Validating viral quasispecies with digital organisms: a reexamination of the critical mutation rate. BMC Evol Biol. 2005;5:5. doi: 10.1186/1471-2148-5-5. [DOI] [PMC free article] [PubMed] [Google Scholar]
- 13.Cowperthwaite MD, Bull JJ, Meyers LA. From bad to good: fitness reversals and the ascent of deleterious mutations. PLoS Comput Biol. 2006;2:1292–300. doi: 10.1371/journal.pcbi.0020141. [DOI] [PMC free article] [PubMed] [Google Scholar]
- 14.Manrubia SC, Escarmis C, Domingo E, Lazaro E. High mutation rates, bottlenecks, and robustness of RNA viral quasispecies. Gene. 2005;347:273–82. doi: 10.1016/j.gene.2004.12.033. [DOI] [PubMed] [Google Scholar]
- 15.Regoes RR, Crotty S, Antia R, Tanaka MM. Optimal replication of poliovirus within cells. Am Nat. 2005;165:364–73. doi: 10.1086/428295. [DOI] [PubMed] [Google Scholar]
- 16.Schulte MB, Andino R. Single-cell analysis uncovers extensive biological noise in poliovirus replication. J Virol. 2014;88:6205–12. doi: 10.1128/JVI.03539-13. [DOI] [PMC free article] [PubMed] [Google Scholar]
- 17.Schulte MB, Draghi JA, Plotkin JB, Andino R. Experimentally guided models reveal replication principles that shape the mutation distribution of RNA viruses. Elife. 2015;4:e03753. doi: 10.7554/eLife.03753. [DOI] [PMC free article] [PubMed] [Google Scholar]
- 18.Restif O, Thaker J, Harvill ET. Analysis with mathematical models provides insights into infectious diseases. Microbe. 2009;4:176–82. [Google Scholar]
- 19.Sidorenko Y, Reichl U. Structured model of influenza virus replication in MDCK cells. Biotechnol Bioeng. 2004;88:1–14. doi: 10.1002/bit.20096. [DOI] [PubMed] [Google Scholar]
- 20.Acevedo A, Brodsky L, Andino R. Mutational and fitness landscapes of an RNA virus revealed through population sequencing. Nature. 2014;505:686–90. doi: 10.1038/nature12861. [DOI] [PMC free article] [PubMed] [Google Scholar]
- 21.Domingo E, Sheldon J, Perales C. Viral quasispecies evolution. Microbiol Mol Biol Rev. 2012;76:159–216. doi: 10.1128/MMBR.05023-11. [DOI] [PMC free article] [PubMed] [Google Scholar]
- 22.Drake JW, Holland JJ. Mutation rates among RNA viruses. Proc Natl Acad Sci U S A. 1999;96:13910–3. doi: 10.1073/pnas.96.24.13910. [DOI] [PMC free article] [PubMed] [Google Scholar]
- 23.Duffy S, Shackelton LA, Holmes EC. Rates of evolutionary change in viruses: patterns and determinants. Nat Rev Genet. 2008;9:267–75. doi: 10.1038/nrg2323. [DOI] [PubMed] [Google Scholar]
- 24.Duggal R, Cuconati A, Gromeier M, Wimmer E. Genetic recombination of poliovirus in a cell-free system. Proc Natl Acad Sci U S A. 1997;94:13786–91. doi: 10.1073/pnas.94.25.13786. [DOI] [PMC free article] [PubMed] [Google Scholar]
- 25.Sanjuan R, Nebot MR, Chirico N, Mansky LM, Belshaw R. Viral mutation rates. J Virol. 2010;84:9733–48. doi: 10.1128/JVI.00694-10. [DOI] [PMC free article] [PubMed] [Google Scholar]
- 26.Lukashev AN. Role of recombination in evolution of enteroviruses. Rev Med Virol. 2005;15:157–67. doi: 10.1002/rmv.457. [DOI] [PubMed] [Google Scholar]
- 27.Simon-Loriere E, Holmes EC. Why do RNA viruses recombine? Nat Rev Microbiol. 2011;9:617–26. doi: 10.1038/nrmicro2614. [DOI] [PMC free article] [PubMed] [Google Scholar]
- 28.Holmblat B, Jegouic S, Muslin C, Blondel B, Joffret M-L, Delpeyroux F. Non-homologous recombination between defective poliovirus and coxsackievirus genomes suggests a new model of genetic plasticity for picornaviruses. mBio. 2014;5:e1119–14. doi: 10.1128/mBio.01119-14. [DOI] [PMC free article] [PubMed] [Google Scholar]
- 29.Matsumoto M. Mersenne Twister: a 623-dimensionally equidistributed uniform pseudo-random number generator. ACM Trans Model Comput Simul. 1998;8:3–30. [Google Scholar]
- 30.Novella IS, Clarke DK, Quer J, et al. Extreme fitness differences in mammalian and insect hosts after continuous replication of vesicular stomatitis virus in sandfly cells. J Virol. 1995;69:6805–9. doi: 10.1128/jvi.69.11.6805-6809.1995. [DOI] [PMC free article] [PubMed] [Google Scholar]
- 31.Vignuzzi M, Wendt E, Andino R. Engineering attenuated virus vaccines by controlling replication fidelity. Nat Med. 2008;14:154–61. doi: 10.1038/nm1726. [DOI] [PubMed] [Google Scholar]
- 32.Runckel C, Westesson O, Andino R, DeRisi JL. Identification and manipulation of the molecular determinants influencing poliovirus recombination. PLoS Pathog. 2013;9:e1003164. doi: 10.1371/journal.ppat.1003164. [DOI] [PMC free article] [PubMed] [Google Scholar]
- 33.Pfeiffer JK, Kirkegaard K. Bottleneck-mediated quasispecies restriction during spread of an RNA virus from inoculation site to brain. Proc Natl Acad Sci U S A. 2006;103:5520–5. doi: 10.1073/pnas.0600834103. [DOI] [PMC free article] [PubMed] [Google Scholar]
- 34.Lauring AS, Frydman J, Andino R. The role of mutational robustness in RNA virus evolution. Nat Rev Microbiol. 2013;11:327–36. doi: 10.1038/nrmicro3003. [DOI] [PMC free article] [PubMed] [Google Scholar]
Associated Data
This section collects any data citations, data availability statements, or supplementary materials included in this article.
Supplementary Materials
Supplementary File 1. Simulation trace for Qspp_main simulation using fitness1 grid and default parameters.
Supplementary File 2. Report extracted at the command line from S1 simulation trace via “grep ‘Report’”.
Supplementary File 3. Mean values generated by calculate_S2M.py for a 10-replicate fitness1 default simulation.


