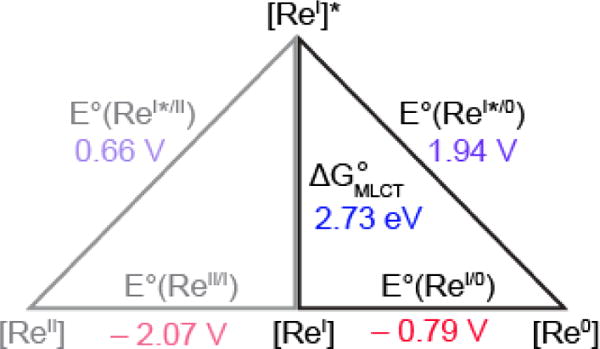
Figure 4.

Latimer diagram describing excited state reduction potentials of [ReI]. ΔGMLCT determined from the E0/0 emission of [Re]-Y356F-β2 frozen in assay buffer at 77 K (Figure S4). Ground state reduction potentials are from ref 50. Values along the diagonal are the calculated excited state reduction potentials.
