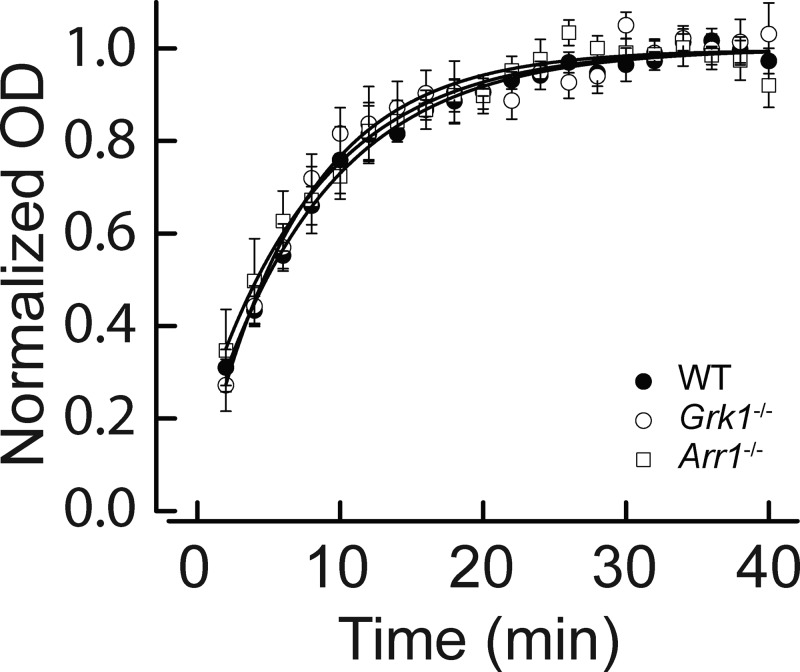
Figure 4.
Time course of rhodopsin regeneration. Rhodopsin regeneration measured as normalized OD at 500 nm after completion of Meta III decay in WT (n = 5), Grk1−/− (n = 5), and Arr1−/− (n = 7) mouse rods after 70% pigment bleaching and exogenous treatment with 10 µM 11-cis retinal. Fitting with single saturation exponential functions yielded regeneration time constants (τ ± SEM) of 8.4 ± 0.4 min (WT), 7.0 ± 0.4 min (Grk1−/−), and 8.2 ± 0.8 min (Arr1−/−). Error bars represent SEM in all panels. All recordings were made at 27°C.

