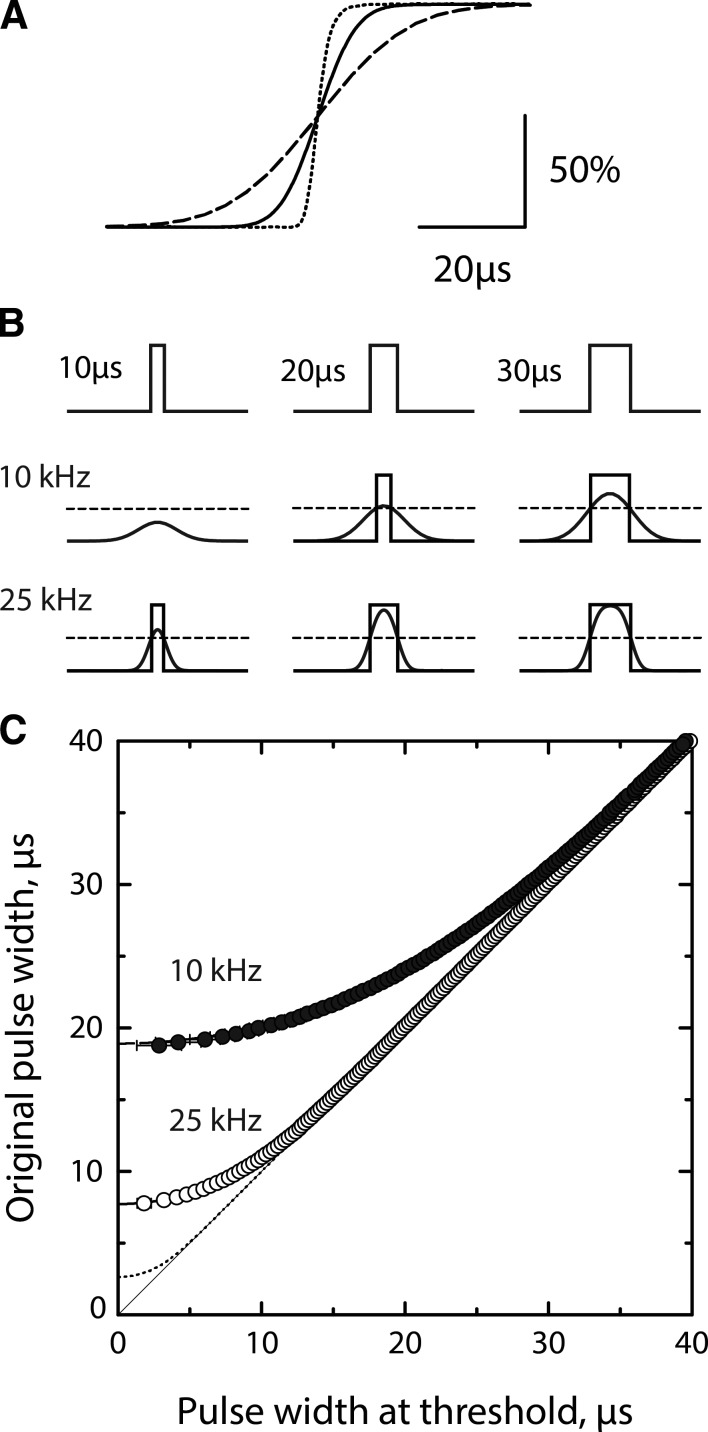
Figure 1.
Patch clamp step response and temporal resolution of current pulses. See Materials and methods. (A) Averaged step response for the patch clamp and internal 100-kHz Bessel filter (dotted curve), sampled at intervals of 0.2 µs, and filtered with a Gaussian digital filter set to 10 kHz (dashed curve) and 25 kHz (continuous curve). The effective Fc for each step response, determined as described in Materials and methods, is 70.086 kHz for the patch clamp with the 100-kHz internal Bessel filter, 23.271 kHz for an additional 25-kHz Gaussian filter, and 9.840 kHz for a 10-kHz Gaussian filter. (B) Current pulses with the indicated durations are sampled at intervals of 0.2 µs and displayed without filtering (top row), with a 10-kHz filter (middle row), and with a 25-kHz filter (bottom row). A detection threshold at half the current amplitude (dashed line) defines the pulse duration at threshold shown by superimposed rectangular pulses. (C) Pulse durations at the detection threshold are plotted against the original pulse durations for the patch clamp with its 100-kHz Bessel filter (dotted curve) and after a Gaussian digital filter of 10 kHz (closed symbols) and 25 kHz (open symbols).

