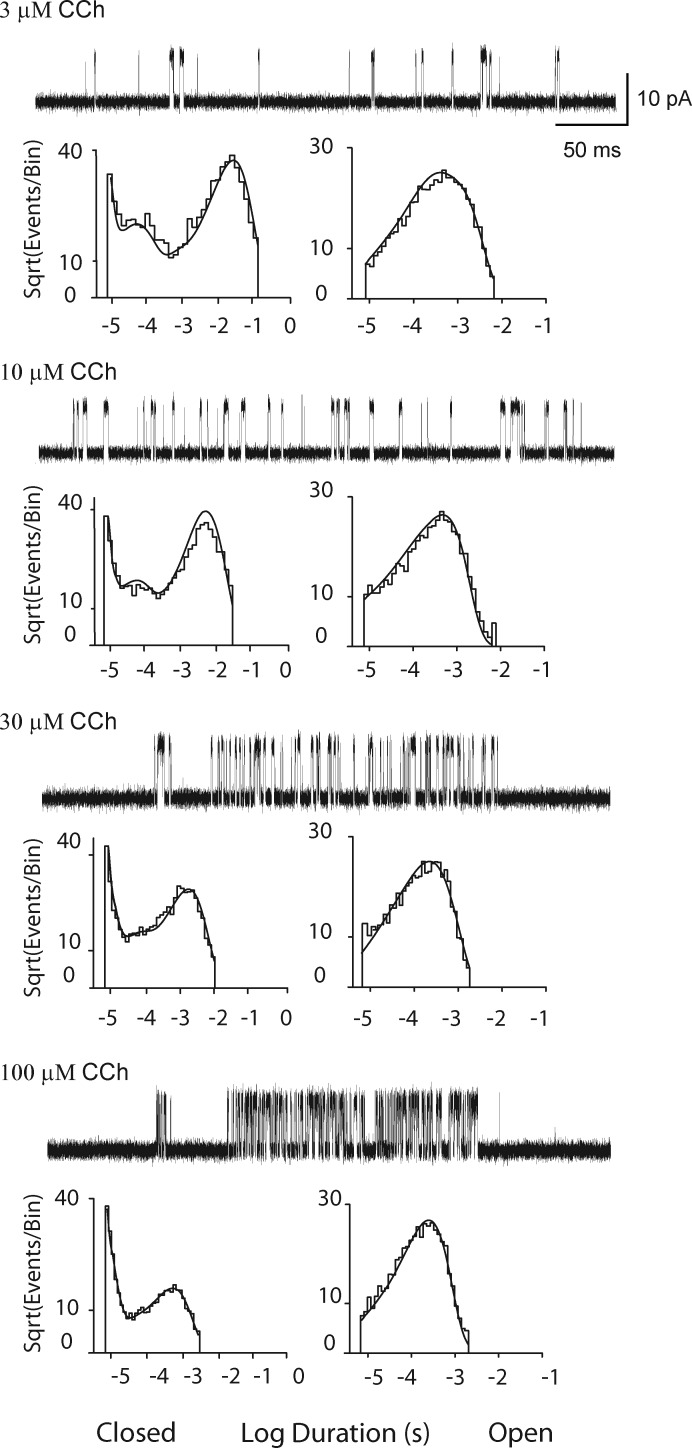
Figure 8.
Analysis of single channel currents from the αG153S AChR activated by CCh. For each of the indicated CCh concentrations, events from a single channel are displayed at a bandwidth of 25 kHz, and the corresponding closed and open time histograms are displayed with the global fit of Scheme 1 to the data overlaid. Rate constants from the global fit are presented in Table 2.

