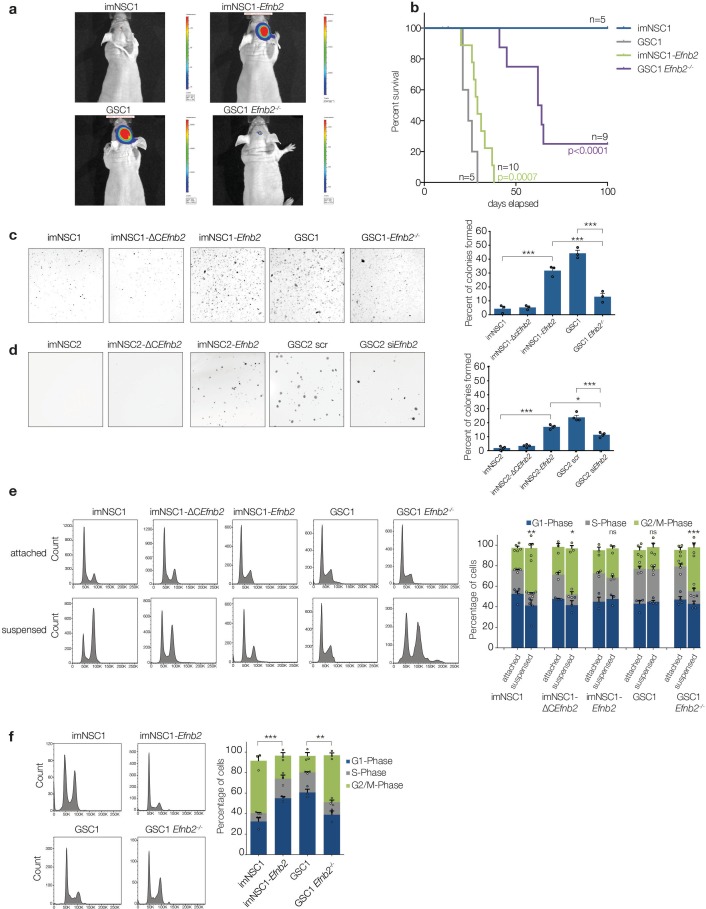
Figure 4. ephrin-B2 is a glioblastoma oncogene controlling anchorage independent proliferation.
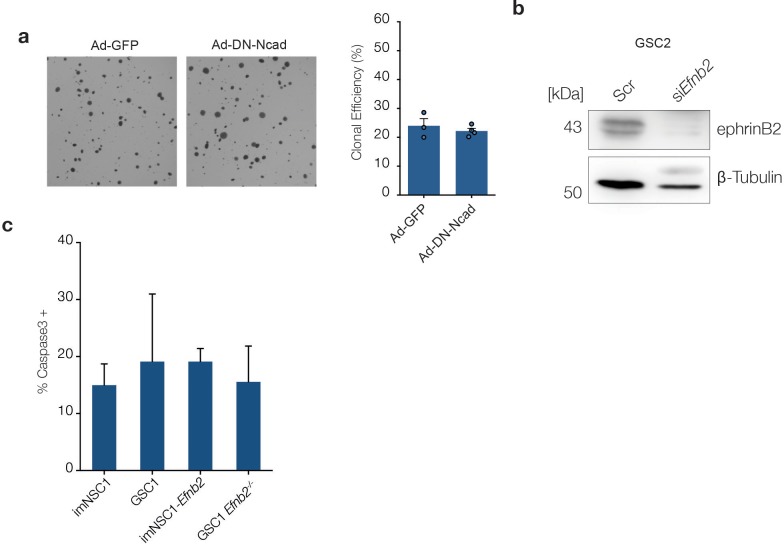
(a) Representative bioluminescent images of nude mice 20 days after intracranial injection of imNSC1, imNSC1-Efnb2, GSC1, GSC1Efnb2-/-. (b) Kaplan-Meier survival plots of the mice depicted in (a). Significance is given relative to imNSC1 for imNSC1-Efnb2 and to GSC1 for GSC1-Efnb2-/-. Log Rank Mantel Cox. (c, d) Left: Representative micrographs of GSC1 (c) and GSC2 (d) cells of indicated genotype grown in soft agar for 10d. Right: quantification of number of colonies formed in soft agar in all cultures, expressed as percentage over total number of seeded cells. n = 3, error bars depict s.e.m. One way ANOVA with Tukey correction. (e) Left: representative FACS profiles of cells grown in attachment or methylcellulose for 72 hr, showing DNA content by propidium iodide (PI) staining. Right: quantification of cell cycle phases from the FACS profiles. n = 3–5 as indicated by the dots. Error bars depict s.e.m., p values indicate significance of changes in G2/M phase. (f) Representative PI FACS profiles and quantifications of imNSC and GSC1 isolated from brain tissue 7 days after intracranial injection. n = 3. Error bars depict s.e.m. One way ANOVA with Tukey post hoc test shown for G2/M phase. See also Figure 4— figure supplement 1 and Figure 4— source data 1.
DOI: http://dx.doi.org/10.7554/eLife.14845.021


