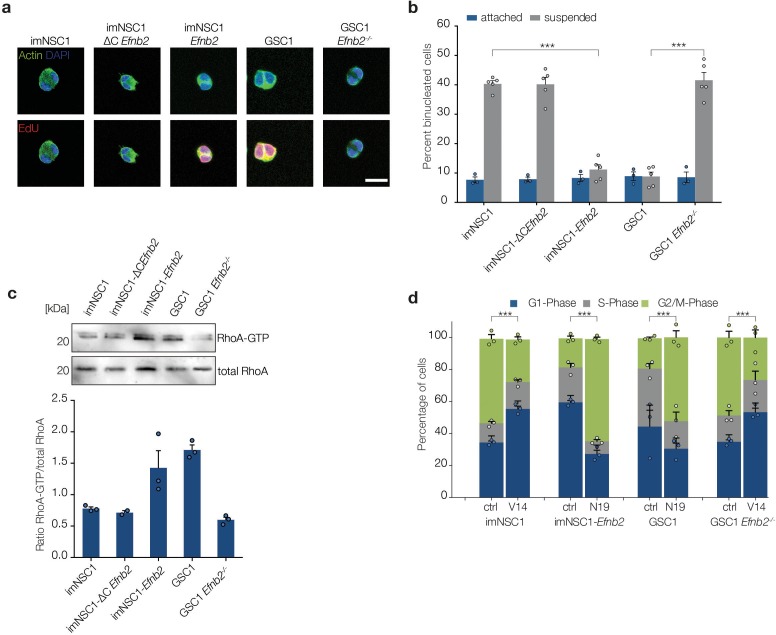
Figure 5. ephrin-B2 mediates cytokinesis in the absence of anchorage through RhoA.
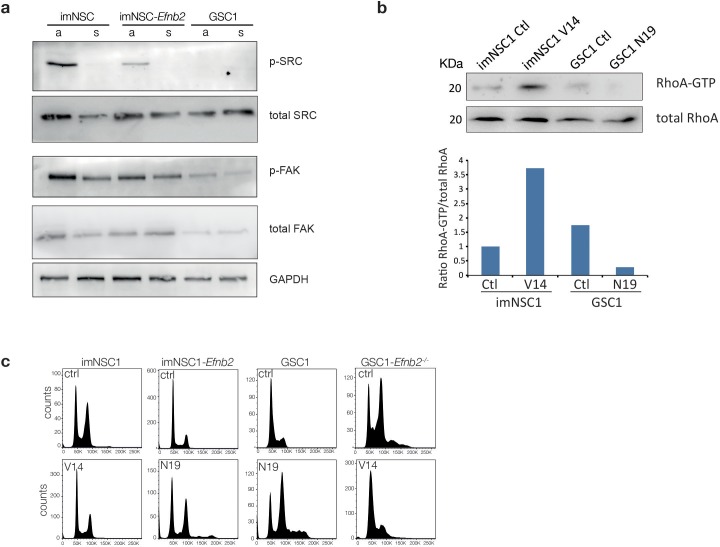
(a) Representative fluorescent images of binucleated cells grown in suspension for 24 hr and stained with phalloidin (green) to label cortical actin and EdU (red) to distinguish cycling from arrested cells. Scale bar = 20 μm. (b) Quantification of binucleated cells in indicated attached and suspended cultures. Values represent percentages over total number of cells. n = 4, error bars denote s.e.m. Two way ANOVA with Tukey post hoc test. (c) Western analysis of RhoA pulldown assays showing levels of activated RhoA (RhoA-GTP) and total RhoA levels in indicated cells grown in suspension for 24 hr . Bottom graph shows quantifications of activated RhoA levels from the western blots. n = 3. Error bars indicate s.e.m. (d) Quantification of the PI cell cycle profile as measured by FACS. Cells transfected with either constitutively active RhoA (V14) or dominant negative RhoA (N19) were grown in suspension for 24 hr . n = 3, error bars depict s.e.m. One way ANOVA with Tukey post hoc test was used to calculate p values for differences in G2/M phase of each suspended culture relative to corresponding attached cultures. See also Figure 5—figure supplement 1 and Figure 5—source data 1.
DOI: http://dx.doi.org/10.7554/eLife.14845.025


