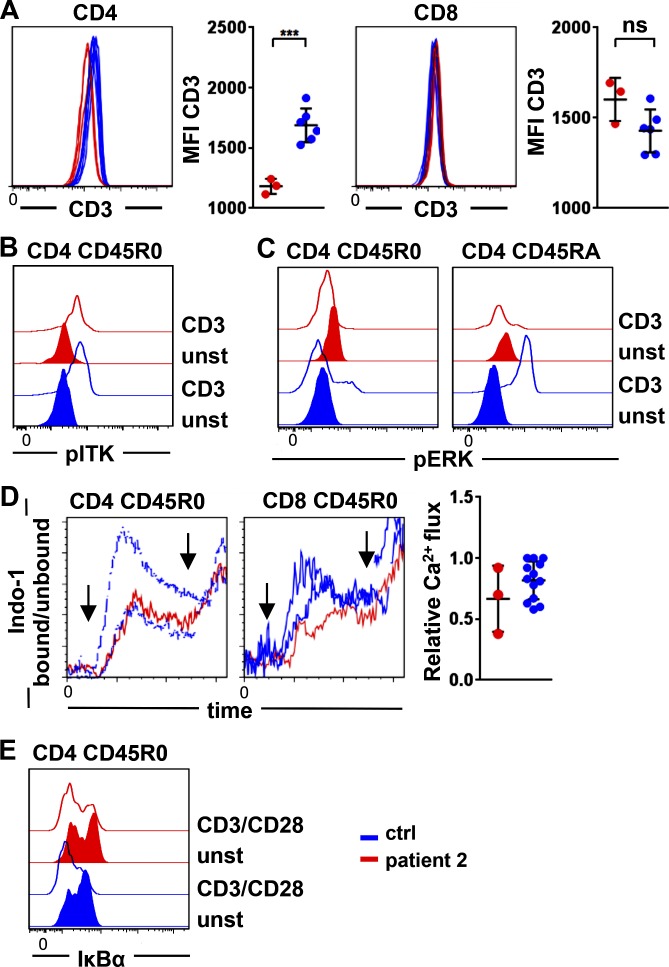
Figure 4.
TCR signaling in primary LAT-mutated T cells. (A) Expression of CD3 on CD4 (left) and CD8 T cells (right) in three different experiments compared with controls. Patient 2 is shown in red, and controls are in blue. MFI, mean fluorescence intensity. ns, not significant. ***, P ≤ 0.001. (B and C) Phosphorylation of ITK (pITK; B) and ERK (pERK; C) in patient’s and controls’ CD45R0 and CD45RA CD4 T cells without (closed) and after CD3 stimulation (open). Results are representative of five and four independent experiments. (D) Ca2+ mobilization after cross-linking of CD3 is depicted in CD45R0 CD4 T cells and CD45R0 CD8 T cells of two controls and the LAT-mutated patient 2. Arrows indicate the addition of goat anti-mouse for CD3 cross-linking and ionomycin. The graph shows the relative Ca2+ influx determined by the peak of Indo-1 bound/unbound normalized to the highest day control in three independent experiments. (E) Degradation of IκBα is shown in CD45R0 CD4 T cells of patient 2 and a healthy control after stimulation with anti-CD3/anti-CD28. Results are representative of two independent experiments. ctrl, control. unst, unstimulated.

